\n
## Diagram: Quadtree Decomposition
### Overview
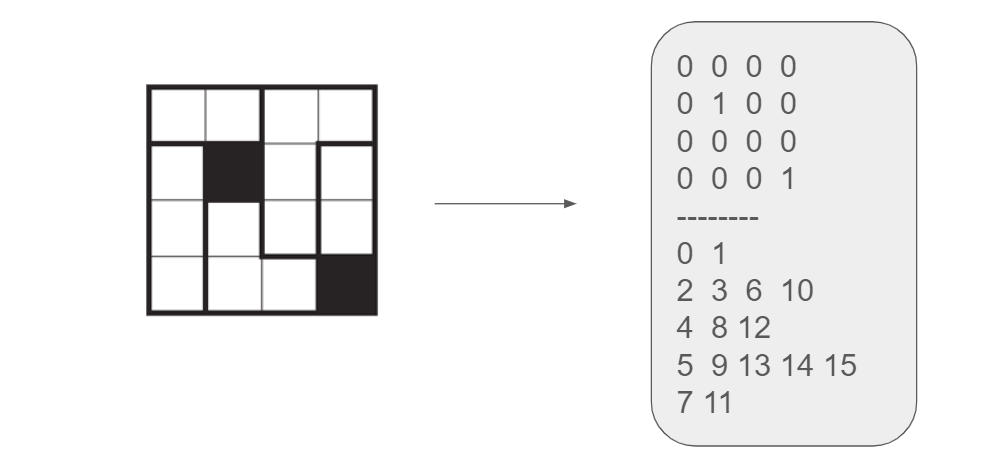
The image depicts a visual representation of quadtree decomposition. A square is recursively divided into four equal quadrants until certain criteria are met (in this case, a threshold of black pixels within a quadrant). The diagram shows the initial square and the resulting quadtree structure represented as a matrix of numbers.
### Components/Axes
The diagram consists of two main parts:
1. **Initial Square:** A square divided into smaller squares, some of which are shaded black.
2. **Quadtree Representation:** A matrix of numbers representing the decomposition. The matrix is arranged in a hierarchical manner, starting with the top-left quadrant and proceeding row by row.
### Detailed Analysis or Content Details
The initial square is divided into 16 smaller squares arranged in a 4x4 grid. Some of these squares are filled with black, while others are white. The quadtree representation shows the decomposition process.
The matrix can be interpreted as follows:
* **First four rows:** `0 0 0 0`, `0 1 0 0`, `0 0 0 0`, `0 0 0 1`. These represent the initial 4x4 grid. The '1' indicates the presence of a black square in that quadrant.
* **Subsequent rows:** `0 1`, `2 3 6 10`, `4 8 12`, `5 9 13 14 15`, `7 11`. These rows represent the further decomposition of quadrants that contain black squares. The numbers likely represent the indices or identifiers of the resulting quadrants.
Specifically:
* Row 1: `0 0 0 0` - All quadrants are white.
* Row 2: `0 1 0 0` - Quadrant 2 (second element) contains a black square.
* Row 3: `0 0 0 0` - All quadrants are white.
* Row 4: `0 0 0 1` - Quadrant 4 (last element) contains a black square.
* Row 5: `0 1` - Quadrant 2 is further decomposed into two quadrants, with the second quadrant containing a black square.
* Row 6: `2 3 6 10` - Quadrant 2 is further decomposed into four quadrants, with quadrants 2, 3, 6, and 10 containing black squares.
* Row 7: `4 8 12` - Quadrant 2 is further decomposed into three quadrants, with quadrants 4, 8, and 12 containing black squares.
* Row 8: `5 9 13 14 15` - Quadrant 2 is further decomposed into five quadrants, with quadrants 5, 9, 13, 14, and 15 containing black squares.
* Row 9: `7 11` - Quadrant 2 is further decomposed into two quadrants, with quadrants 7 and 11 containing black squares.
### Key Observations
The decomposition continues until quadrants are either entirely white or contain a single black square. The numbers in the matrix seem to be a unique identifier for each quadrant as it is further subdivided. The decomposition is not uniform; some quadrants are subdivided more than others, depending on the distribution of black squares.
### Interpretation
This diagram illustrates the principle of quadtree decomposition, a hierarchical data structure commonly used in image processing, spatial indexing, and computer graphics. The process recursively divides a two-dimensional space into four equal quadrants, allowing for efficient representation and manipulation of spatial data. The presence of black squares triggers further decomposition, while white quadrants remain undivided. The numbers in the matrix likely serve as unique identifiers for each quadrant, enabling efficient traversal and access to the data. The diagram demonstrates how a complex image can be represented in a hierarchical manner, facilitating tasks such as compression, searching, and rendering. The uneven decomposition suggests that the distribution of black squares is not uniform, leading to varying levels of detail in different regions of the image.