## Scatter Plot: Layer 10, head 16
### Overview
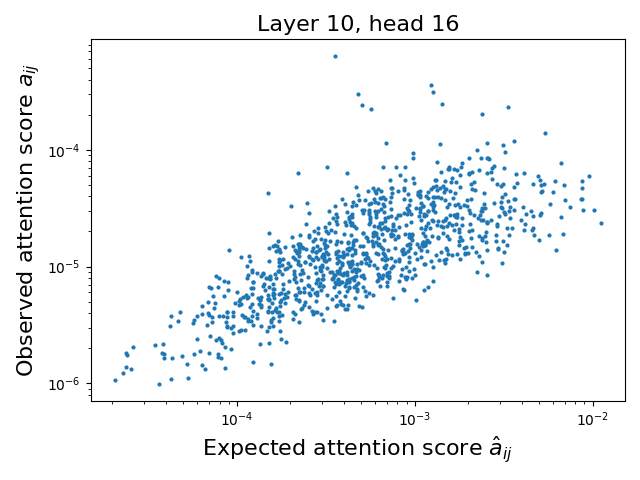
The image is a scatter plot comparing observed attention scores (`a_ij`) to expected attention scores (`â_ij`) for a specific neural network layer (Layer 10, head 16). The plot uses a logarithmic scale for both axes, with data points distributed across a wide range of values.
### Components/Axes
- **Title**: "Layer 10, head 16" (centered at the top).
- **X-axis**: "Expected attention score â_ij" (logarithmic scale, 10⁻⁴ to 10⁻²).
- **Y-axis**: "Observed attention score a_ij" (logarithmic scale, 10⁻⁶ to 10⁻⁴).
- **Data Points**: Blue dots representing individual observations. No legend is present, but all points are uniformly blue.
- **Scale**: Both axes use a logarithmic scale, with gridlines visible for reference.
### Detailed Analysis
- **Data Distribution**:
- Most points cluster between 10⁻⁴ and 10⁻³ on the x-axis and 10⁻⁵ to 10⁻⁴ on the y-axis.
- A diagonal trend is visible, with points generally aligning along a line where observed scores increase as expected scores increase.
- Outliers exist at the extremes:
- A few points near 10⁻² on the x-axis (high expected scores) have observed scores as low as 10⁻⁶.
- A cluster of points near 10⁻⁴ on the x-axis has observed scores ranging from 10⁻⁶ to 10⁻⁵.
### Key Observations
1. **Positive Correlation**: The majority of points follow a diagonal trend, suggesting observed scores often align with expected values.
2. **Discrepancies**:
- Some points deviate significantly from the trend, particularly at high expected scores (e.g., 10⁻²), where observed scores are much lower.
- At low expected scores (10⁻⁴), observed scores vary widely, indicating potential model instability or noise.
3. **Logarithmic Scale**: The use of a logarithmic scale emphasizes multiplicative relationships, making small differences in attention scores more visually apparent.
### Interpretation
The plot demonstrates that the model's attention mechanism (Layer 10, head 16) generally produces observed scores consistent with expected values, but with notable exceptions. The diagonal trend implies the model's attention is largely predictable, but outliers suggest cases where the model underperforms or overestimates attention. The logarithmic scale highlights that even small deviations (e.g., 10⁻⁵ vs. 10⁻⁴) can represent significant differences in attention magnitude. This could indicate areas for model refinement, such as improving stability at low-attention regions or addressing overestimation at high-attention regions.