## Line Chart: Decoding Throughput
### Overview
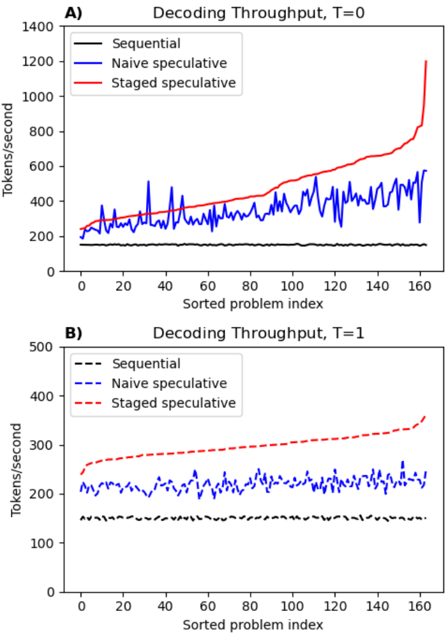
The image contains two line charts comparing the decoding throughput of three different methods: Sequential, Naive speculative, and Staged speculative. Chart A displays the throughput when T=0, and Chart B displays the throughput when T=1. The x-axis represents the sorted problem index, and the y-axis represents the throughput in tokens per second.
### Components/Axes
**Chart A (Top): Decoding Throughput, T=0**
* **Title:** Decoding Throughput, T=0
* **X-axis:** Sorted problem index, ranging from 0 to 160.
* **Y-axis:** Tokens/second, ranging from 0 to 1400.
* **Legend (Top-Left):**
* Black line: Sequential
* Blue line: Naive speculative
* Red line: Staged speculative
**Chart B (Bottom): Decoding Throughput, T=1**
* **Title:** Decoding Throughput, T=1
* **X-axis:** Sorted problem index, ranging from 0 to 160.
* **Y-axis:** Tokens/second, ranging from 0 to 500.
* **Legend (Top-Left):**
* Black dashed line: Sequential
* Blue dashed line: Naive speculative
* Red dashed line: Staged speculative
### Detailed Analysis
**Chart A (T=0):**
* **Sequential (Black):** The throughput remains relatively constant around 150 tokens/second across all problem indices.
* Value: ~150 tokens/second
* **Naive speculative (Blue):** The throughput fluctuates between approximately 200 and 550 tokens/second.
* Range: 200-550 tokens/second
* **Staged speculative (Red):** The throughput generally increases with the problem index, starting around 200 tokens/second and reaching approximately 1200 tokens/second at the end.
* Start: ~200 tokens/second
* End: ~1200 tokens/second
**Chart B (T=1):**
* **Sequential (Black Dashed):** The throughput remains relatively constant around 150 tokens/second across all problem indices.
* Value: ~150 tokens/second
* **Naive speculative (Blue Dashed):** The throughput fluctuates between approximately 200 and 250 tokens/second.
* Range: 200-250 tokens/second
* **Staged speculative (Red Dashed):** The throughput gradually increases with the problem index, starting around 250 tokens/second and reaching approximately 370 tokens/second at the end.
* Start: ~250 tokens/second
* End: ~370 tokens/second
### Key Observations
* In both charts, the Sequential method has the lowest throughput, remaining relatively constant.
* The Naive speculative method shows significant fluctuations in throughput, especially when T=0.
* The Staged speculative method generally shows an increasing throughput as the problem index increases.
* The throughput values are generally lower when T=1 compared to T=0.
### Interpretation
The charts compare the decoding throughput of three methods under different conditions (T=0 and T=1). The Staged speculative method appears to be the most effective, especially when T=0, as it achieves the highest throughput for larger problem indices. The Naive speculative method's performance is inconsistent, with significant fluctuations. The Sequential method consistently provides the lowest throughput. The difference in throughput between T=0 and T=1 suggests that the value of T has a significant impact on the performance of the speculative methods, with T=0 generally yielding higher throughput. The increasing trend of the Staged speculative method indicates that it may be better suited for more complex or larger problems.