\n
## Line Chart: Decoding Throughput vs. Sorted Problem Index
### Overview
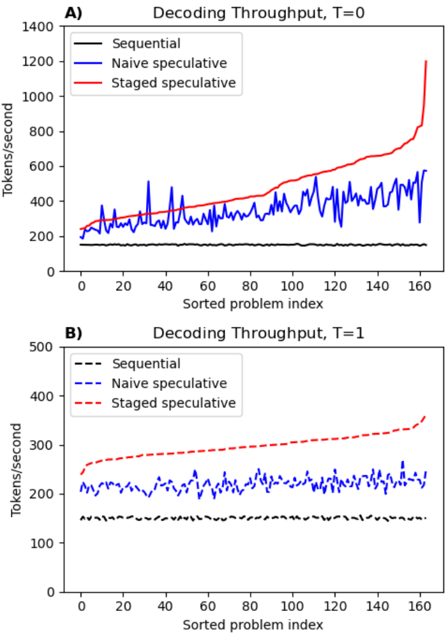
The image presents two line charts (A and B) comparing the decoding throughput of three different methods – Sequential, Naive speculative, and Staged speculative – across a sorted problem index. Chart A shows data for T=0, and Chart B shows data for T=1. The y-axis represents decoding throughput in tokens/second, and the x-axis represents the sorted problem index, ranging from 0 to approximately 160.
### Components/Axes
* **Title A:** Decoding Throughput, T=0 (top-left)
* **Title B:** Decoding Throughput, T=1 (bottom-left)
* **X-axis Label:** Sorted problem index (both charts)
* **Y-axis Label:** Tokens/second (both charts)
* **Legend A (top-left):**
* Sequential (Solid Blue Line)
* Naive speculative (Solid Purple Line)
* Staged speculative (Solid Red Line)
* **Legend B (bottom-left):**
* Sequential (Dashed Black Line)
* Naive speculative (Dashed Blue Line)
* Staged speculative (Dashed Red Line)
* **X-axis Scale:** Linear, from 0 to 160.
* **Y-axis Scale:** Linear, from 0 to 1400 in Chart A, and 0 to 500 in Chart B.
### Detailed Analysis or Content Details
**Chart A (T=0):**
* **Sequential (Solid Blue Line):** The line fluctuates significantly between approximately 200 and 600 tokens/second. It starts around 300, dips to around 200 at index 5, rises to a peak of approximately 550 at index 15, then oscillates with a general upward trend towards the end of the index, reaching around 600 tokens/second at index 160.
* **Naive speculative (Solid Purple Line):** The line is relatively stable, fluctuating between approximately 200 and 400 tokens/second. It starts around 300, dips to around 250 at index 5, and remains relatively constant throughout the index, ending around 300 tokens/second at index 160.
* **Staged speculative (Solid Red Line):** The line shows a clear upward trend. It starts around 300 tokens/second, gradually increases to approximately 600 tokens/second at index 100, and then rapidly increases to approximately 900 tokens/second at index 160.
**Chart B (T=1):**
* **Sequential (Dashed Black Line):** The line remains relatively low and stable, fluctuating between approximately 100 and 200 tokens/second. It starts around 150, dips to around 100 at index 5, and remains relatively constant throughout the index, ending around 150 tokens/second at index 160.
* **Naive speculative (Dashed Blue Line):** The line fluctuates between approximately 150 and 250 tokens/second. It starts around 200, dips to around 150 at index 5, and remains relatively constant throughout the index, ending around 200 tokens/second at index 160.
* **Staged speculative (Dashed Red Line):** The line shows a clear upward trend. It starts around 200 tokens/second, gradually increases to approximately 300 tokens/second at index 100, and then continues to increase, reaching approximately 350 tokens/second at index 160.
### Key Observations
* In both charts, the "Staged speculative" method consistently demonstrates the highest throughput, especially as the problem index increases.
* The "Sequential" method exhibits the most variability in throughput.
* The "Naive speculative" method maintains a relatively stable throughput, but lower than the "Staged speculative" method.
* The throughput values are generally lower in Chart B (T=1) compared to Chart A (T=0) for all methods.
### Interpretation
The data suggests that the "Staged speculative" method is the most efficient for decoding, particularly as the complexity of the problem (represented by the sorted problem index) increases. The increasing throughput with the "Staged speculative" method indicates that it effectively leverages speculative computation to accelerate the decoding process. The "Sequential" method's variability suggests it is more sensitive to the specific characteristics of each problem. The lower throughput in Chart B (T=1) compared to Chart A (T=0) could indicate that the benefits of speculative decoding diminish or are offset by other factors as the decoding process progresses (perhaps due to increased overhead or dependencies). The charts demonstrate a clear trade-off between stability and throughput, with the "Naive speculative" method offering stability at the cost of lower performance, and the "Staged speculative" method maximizing throughput with potentially more variability. The data points to the "Staged speculative" method being the most promising approach for improving decoding performance, but further investigation may be needed to understand the factors influencing its performance at different stages of the decoding process.