## Line Chart: Decoding Throughput Comparison
### Overview
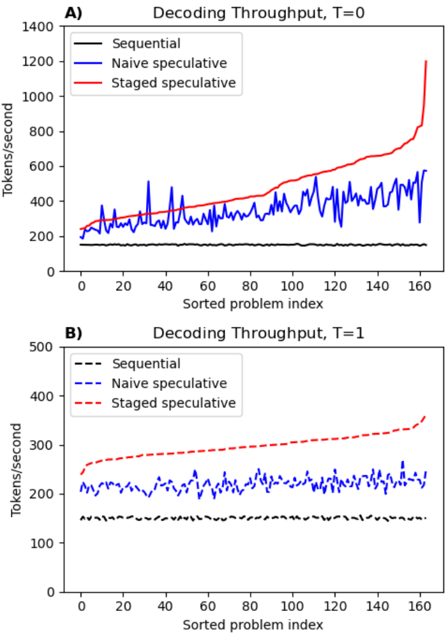
The image contains two line charts, labeled **A)** and **B)**, comparing the performance of three decoding methods ("Sequential", "Naive speculative", "Staged speculative") across a sorted problem index. The primary metric is throughput measured in tokens per second. Chart A shows results for a parameter `T=0`, while Chart B shows results for `T=1`.
### Components/Axes
**Chart A (Top):**
* **Title:** `Decoding Throughput, T=0`
* **Y-axis:** Label: `Tokens/second`. Scale: 0 to 1400, with major ticks at 0, 200, 400, 600, 800, 1000, 1200, 1400.
* **X-axis:** Label: `Sorted problem index`. Scale: 0 to 160, with major ticks at 0, 20, 40, 60, 80, 100, 120, 140, 160.
* **Legend (Top-left corner):**
* `Sequential` - Solid black line.
* `Naive speculative` - Solid blue line.
* `Staged speculative` - Solid red line.
**Chart B (Bottom):**
* **Title:** `Decoding Throughput, T=1`
* **Y-axis:** Label: `Tokens/second`. Scale: 0 to 500, with major ticks at 0, 100, 200, 300, 400, 500.
* **X-axis:** Label: `Sorted problem index`. Scale: 0 to 160, with major ticks at 0, 20, 40, 60, 80, 100, 120, 140, 160.
* **Legend (Top-left corner):**
* `Sequential` - Dashed black line.
* `Naive speculative` - Dashed blue line.
* `Staged speculative` - Dashed red line.
### Detailed Analysis
**Chart A (T=0):**
* **Sequential (Black):** The line is nearly flat, hovering consistently around **~200 tokens/second** across the entire problem index range (0-160). It shows minimal variance.
* **Naive speculative (Blue):** The line is highly volatile, fluctuating significantly between approximately **200 and 600 tokens/second**. There is no clear upward or downward trend; it oscillates around a mean of roughly **~400 tokens/second**.
* **Staged speculative (Red):** The line shows a clear, steady upward trend. It starts near **~200 tokens/second** at index 0, rises gradually to about **~600 tokens/second** by index 120, and then exhibits a sharp, near-exponential increase, peaking at approximately **~1200 tokens/second** at index 160. This is the highest throughput value in the entire image.
**Chart B (T=1):**
* **Sequential (Black, Dashed):** Similar to Chart A, this line is flat and stable, positioned at approximately **~150 tokens/second**.
* **Naive speculative (Blue, Dashed):** This line is also volatile but within a lower and narrower range than in Chart A, fluctuating between roughly **180 and 250 tokens/second**.
* **Staged speculative (Red, Dashed):** This line shows a steady, linear upward trend. It begins at approximately **~250 tokens/second** at index 0 and increases consistently to about **~350 tokens/second** at index 160. The slope is positive but much less steep than the final segment of the red line in Chart A.
### Key Observations
1. **Performance Hierarchy:** In both charts, the `Staged speculative` method (red) achieves the highest throughput, followed by `Naive speculative` (blue), with `Sequential` (black) being the slowest.
2. **Impact of Parameter T:** Changing the parameter from `T=0` to `T=1` dramatically reduces the maximum throughput for all methods. The peak for `Staged speculative` drops from ~1200 to ~350 tokens/second.
3. **Volatility:** The `Naive speculative` method exhibits high volatility (noisy, spiky line) in both scenarios, whereas the `Sequential` method is extremely stable.
4. **Trend Shape:** The `Staged speculative` method's performance improves with the problem index. At `T=0`, this improvement is non-linear and accelerates sharply at the high end. At `T=1`, the improvement is linear and more modest.
5. **Outlier:** The final data point for `Staged speculative` in Chart A (~1200 tokens/second) is a significant outlier compared to all other data points in both charts.
### Interpretation
The data demonstrates the clear performance advantage of speculative decoding techniques over sequential decoding for the measured task. The `Staged speculative` approach is superior to the `Naive` variant, suggesting that its underlying algorithm is more efficient at leveraging parallelism or reducing overhead.
The parameter `T` (likely representing a timeout, token limit, or temperature) has a profound effect on system performance. A lower `T=0` allows for much higher peak throughput, especially for the optimized `Staged speculative` method, but may come with trade-offs not shown here (e.g., accuracy, resource usage). The `T=1` setting appears to constrain performance, flattening the advantage of the staged method and reducing overall speed.
The volatility of the `Naive speculative` method indicates its performance is highly sensitive to the specific problem instance (the "Sorted problem index"), whereas the `Staged` method provides more predictable, monotonically increasing performance. The sorting of the problem index on the x-axis is crucial; it reveals that the `Staged speculative` method's efficiency gains are correlated with whatever property defines this sorted order (e.g., problem complexity, sequence length). The sharp uptick at the end of Chart A suggests a potential "sweet spot" or a change in problem characteristics at the highest indices that the staged method is uniquely equipped to exploit.