## Line Charts: Decoding Throughput Comparison (T=0 and T=1)
### Overview
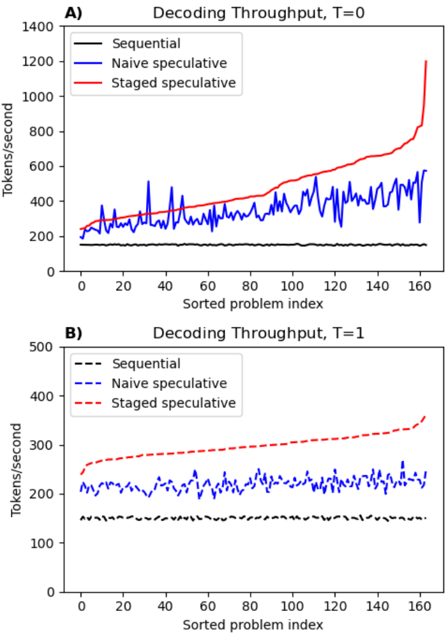
The image contains two line charts (A and B) comparing decoding throughput (tokens/second) across three methods: Sequential, Naive speculative, and Staged speculative. Chart A represents T=0, while Chart B represents T=1. Both charts plot throughput against a "Sorted problem index" (0–160). The charts highlight performance differences between methods under varying conditions.
---
### Components/Axes
- **X-axis**: "Sorted problem index" (0–160, linear scale).
- **Y-axis**: "Tokens/second" (range varies by chart: 0–1400 for A, 0–500 for B).
- **Legends**:
- **Chart A**: Top-left corner, with solid lines (Sequential: black, Naive speculative: blue, Staged speculative: red).
- **Chart B**: Bottom-right corner, with dashed lines (Sequential: black, Naive speculative: blue, Staged speculative: red).
- **Line styles**: Solid for Chart A, dashed for Chart B.
---
### Detailed Analysis
#### Chart A (T=0)
- **Sequential (black)**: Flat line, consistently ~100–200 tokens/sec.
- **Naive speculative (blue)**: Noisy line with peaks (up to ~500 tokens/sec) and troughs (~200 tokens/sec). Average ~300–400 tokens/sec.
- **Staged speculative (red)**: Gradual upward trend, starting ~200 tokens/sec, surging to ~1200 tokens/sec by index 160.
#### Chart B (T=1)
- **Sequential (black)**: Flat line, ~100–150 tokens/sec.
- **Naive speculative (blue)**: Stable but lower than Chart A, ~200–300 tokens/sec.
- **Staged speculative (red)**: Steady increase from ~250 to ~400 tokens/sec.
---
### Key Observations
1. **Staged speculative** dominates in throughput, especially in Chart A (T=0), where it reaches ~1200 tokens/sec by the final problem index.
2. **Naive speculative** shows high variability in Chart A but stabilizes in Chart B, suggesting sensitivity to T=0 conditions.
3. **Sequential** remains the least performant method in both charts, with minimal throughput (~100–200 tokens/sec).
4. **T=1** (Chart B) reduces overall throughput compared to T=0, particularly for Staged speculative (~400 vs. ~1200 tokens/sec).
---
### Interpretation
- **Staged speculative** likely optimizes resource allocation or parallelism, enabling higher throughput as problem complexity (index) increases. Its sharp rise in Chart A suggests adaptive efficiency under T=0.
- The **Naive speculative** method’s volatility in Chart A may indicate instability or overhead at T=0, which stabilizes at T=1.
- The **Sequential** method’s flat performance implies it lacks scalability or parallel processing capabilities.
- The **T=1** condition (Chart B) introduces a performance penalty across all methods, possibly due to increased computational constraints or latency. This could reflect a trade-off between speculative gains and system overhead.
The data underscores the superiority of staged speculative decoding for high-throughput scenarios, while highlighting the need to balance speculative strategies with system-specific constraints (e.g., T=0 vs. T=1).