## Line Charts: Cross-Entropy vs. Percentage of Interleaved/Text
### Overview
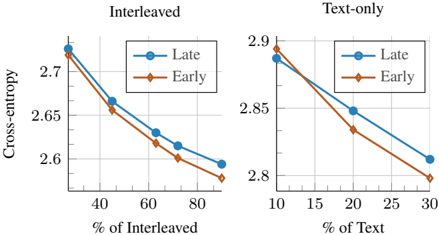
The image presents two line charts comparing "Late" and "Early" models in terms of cross-entropy. The left chart shows the relationship between cross-entropy and the percentage of interleaved data, while the right chart shows the relationship between cross-entropy and the percentage of text-only data. Both charts display two data series: "Late" and "Early."
### Components/Axes
**Left Chart (Interleaved):**
* **Title:** Interleaved
* **Y-axis:** Cross-entropy
* Scale ranges from approximately 2.58 to 2.78.
* **X-axis:** % of Interleaved
* Scale: 40, 60, 80
* **Legend:** Located in the top-right corner of the chart.
* Blue line with circle markers: Late
* Brown line with diamond markers: Early
**Right Chart (Text-only):**
* **Title:** Text-only
* **Y-axis:** Cross-entropy
* Scale ranges from approximately 2.78 to 2.9.
* **X-axis:** % of Text
* Scale: 10, 20, 30
* **Legend:** Located in the top-right corner of the chart.
* Blue line with circle markers: Late
* Brown line with diamond markers: Early
### Detailed Analysis
**Left Chart (Interleaved):**
* **Late (Blue):** The line slopes downward.
* At 40% Interleaved, Cross-entropy ≈ 2.73
* At 60% Interleaved, Cross-entropy ≈ 2.63
* At 80% Interleaved, Cross-entropy ≈ 2.59
* **Early (Brown):** The line slopes downward.
* At 40% Interleaved, Cross-entropy ≈ 2.66
* At 60% Interleaved, Cross-entropy ≈ 2.62
* At 80% Interleaved, Cross-entropy ≈ 2.57
**Right Chart (Text-only):**
* **Late (Blue):** The line slopes downward.
* At 10% Text, Cross-entropy ≈ 2.88
* At 20% Text, Cross-entropy ≈ 2.85
* At 30% Text, Cross-entropy ≈ 2.80
* **Early (Brown):** The line slopes downward.
* At 10% Text, Cross-entropy ≈ 2.89
* At 20% Text, Cross-entropy ≈ 2.83
* At 30% Text, Cross-entropy ≈ 2.79
### Key Observations
* In both charts, cross-entropy decreases as the percentage of interleaved or text-only data increases.
* The "Early" model generally has a slightly lower cross-entropy than the "Late" model for both interleaved and text-only data.
* The decrease in cross-entropy appears to be more pronounced in the "Text-only" chart compared to the "Interleaved" chart.
### Interpretation
The charts suggest that increasing the percentage of interleaved or text-only data improves the performance of both "Late" and "Early" models, as indicated by the decrease in cross-entropy. The "Early" model seems to perform slightly better than the "Late" model under both conditions. The more significant drop in cross-entropy in the "Text-only" chart might indicate that the models benefit more from increasing the percentage of text-only data compared to interleaved data. This could be due to the nature of the task or the specific characteristics of the models.