\n
## Line Chart: Cross-Entropy vs. Interleaving/Text Percentage
### Overview
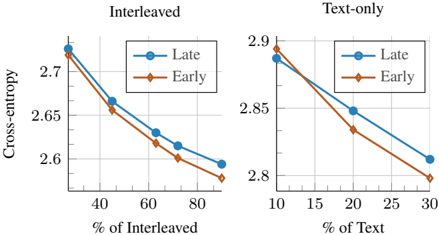
The image presents two line charts comparing cross-entropy values for "Late" and "Early" conditions under two different scenarios: "Interleaved" and "Text-only". The charts visualize the relationship between cross-entropy and the percentage of interleaving or text. Each chart has error bars, but the values are not clearly visible.
### Components/Axes
* **Y-axis (Both Charts):** "Cross-entropy" with a scale ranging from approximately 2.6 to 2.9.
* **X-axis (Left Chart):** "% of Interleaved" with a scale ranging from approximately 30 to 90.
* **X-axis (Right Chart):** "% of Text" with a scale ranging from approximately 10 to 30.
* **Legend (Both Charts):**
* "Late" - Represented by a blue line with circular markers.
* "Early" - Represented by an orange/brown line with diamond markers.
* **Titles:**
* Left Chart: "Interleaved"
* Right Chart: "Text-only"
### Detailed Analysis or Content Details
**Left Chart: Interleaved**
* **"Late" Line:** The blue line slopes downward, indicating a decrease in cross-entropy as the percentage of interleaved content increases.
* At approximately 30% Interleaved: Cross-entropy is around 2.72.
* At approximately 60% Interleaved: Cross-entropy is around 2.64.
* At approximately 90% Interleaved: Cross-entropy is around 2.60.
* **"Early" Line:** The orange/brown line also slopes downward, but is generally above the "Late" line.
* At approximately 30% Interleaved: Cross-entropy is around 2.75.
* At approximately 60% Interleaved: Cross-entropy is around 2.62.
* At approximately 90% Interleaved: Cross-entropy is around 2.58.
**Right Chart: Text-only**
* **"Late" Line:** The blue line slopes downward, indicating a decrease in cross-entropy as the percentage of text increases.
* At approximately 10% Text: Cross-entropy is around 2.90.
* At approximately 20% Text: Cross-entropy is around 2.86.
* At approximately 30% Text: Cross-entropy is around 2.82.
* **"Early" Line:** The orange/brown line also slopes downward, and is generally above the "Late" line.
* At approximately 10% Text: Cross-entropy is around 2.92.
* At approximately 20% Text: Cross-entropy is around 2.87.
* At approximately 30% Text: Cross-entropy is around 2.83.
### Key Observations
* In both charts, cross-entropy decreases as the percentage of interleaved content or text increases.
* The "Early" condition consistently exhibits higher cross-entropy values than the "Late" condition across both scenarios.
* The rate of decrease in cross-entropy appears to be more pronounced at lower percentages of interleaving/text.
* Error bars are present, but their magnitude is difficult to determine visually.
### Interpretation
The data suggests that increasing the proportion of interleaved content or text leads to a reduction in cross-entropy, indicating improved performance or a better fit between the model and the data. The consistently higher cross-entropy values for the "Early" condition suggest that the "Late" condition is more effective or better aligned with the data. The difference in cross-entropy between the "Early" and "Late" conditions may indicate a learning or adaptation effect over time. The charts demonstrate the impact of content presentation (interleaved vs. text-only) and timing ("Early" vs. "Late") on cross-entropy, a measure of the difference between the predicted probability distribution and the true distribution. The decreasing trend in cross-entropy with increasing percentage suggests that more content or a more integrated presentation leads to a more accurate model.