## Chart: Validation Loss and N/D vs. FLOPs
### Overview
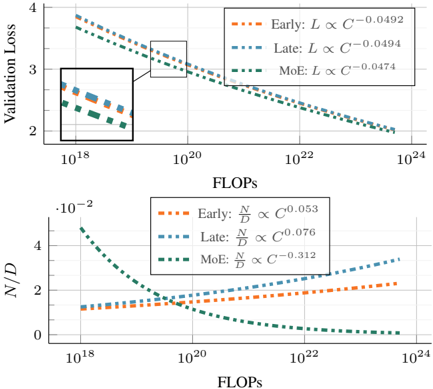
The image presents two line charts comparing the performance of "Early," "Late," and "MoE" models. The top chart shows Validation Loss as a function of FLOPs (Floating Point Operations Per Second), while the bottom chart shows the ratio N/D as a function of FLOPs. Both charts use a logarithmic scale for the x-axis (FLOPs).
### Components/Axes
**Top Chart:**
* **Y-axis:** "Validation Loss" (linear scale, range approximately 2 to 4)
* **X-axis:** "FLOPs" (logarithmic scale, range 10^18 to 10^24)
* **Legend (top-right):**
* Orange dotted line: "Early: L ∝ C^-0.0492"
* Blue dotted line: "Late: L ∝ C^-0.0494"
* Green dotted line: "MoE: L ∝ C^-0.0474"
**Bottom Chart:**
* **Y-axis:** "N/D" (linear scale, range approximately 0 to 4 * 10^-2)
* **X-axis:** "FLOPs" (logarithmic scale, range 10^18 to 10^24)
* **Legend (top-right):**
* Orange dotted line: "Early: N/D ∝ C^0.053"
* Blue dotted line: "Late: N/D ∝ C^0.076"
* Green dotted line: "MoE: N/D ∝ C^-0.312"
### Detailed Analysis
**Top Chart (Validation Loss vs. FLOPs):**
* **Early (Orange):** The validation loss decreases as FLOPs increase. At 10^18 FLOPs, the validation loss is approximately 3.7. At 10^24 FLOPs, the validation loss is approximately 2.0.
* **Late (Blue):** The validation loss decreases as FLOPs increase. At 10^18 FLOPs, the validation loss is approximately 3.6. At 10^24 FLOPs, the validation loss is approximately 2.0.
* **MoE (Green):** The validation loss decreases as FLOPs increase. At 10^18 FLOPs, the validation loss is approximately 3.5. At 10^24 FLOPs, the validation loss is approximately 1.9.
**Bottom Chart (N/D vs. FLOPs):**
* **Early (Orange):** The N/D ratio increases as FLOPs increase. At 10^18 FLOPs, the N/D ratio is approximately 0.012. At 10^24 FLOPs, the N/D ratio is approximately 0.018.
* **Late (Blue):** The N/D ratio increases as FLOPs increase. At 10^18 FLOPs, the N/D ratio is approximately 0.014. At 10^24 FLOPs, the N/D ratio is approximately 0.028.
* **MoE (Green):** The N/D ratio decreases as FLOPs increase. At 10^18 FLOPs, the N/D ratio is approximately 0.048. At 10^24 FLOPs, the N/D ratio is approximately 0.001.
### Key Observations
* In the top chart, all three models ("Early," "Late," and "MoE") show a decrease in validation loss as FLOPs increase, indicating improved performance with more computation.
* In the bottom chart, the "Early" and "Late" models show an increase in the N/D ratio as FLOPs increase, while the "MoE" model shows a significant decrease in the N/D ratio as FLOPs increase.
* The "MoE" model has the lowest validation loss at higher FLOPs.
### Interpretation
The charts suggest that increasing FLOPs generally leads to a decrease in validation loss for all three models, indicating better model performance. However, the behavior of the N/D ratio differs significantly between the "MoE" model and the "Early" and "Late" models. The decreasing N/D ratio for the "MoE" model as FLOPs increase could indicate a more efficient use of computational resources or a different scaling behavior compared to the other models. The "MoE" model appears to be the most effective in reducing validation loss at higher FLOPs, suggesting it may be a more scalable architecture for this particular task. The relationships L ∝ C^-0.0492, L ∝ C^-0.0494, L ∝ C^-0.0474, N/D ∝ C^0.053, N/D ∝ C^0.076, and N/D ∝ C^-0.312 describe the power-law scaling of Validation Loss (L) and N/D with respect to FLOPs (C) for each model.