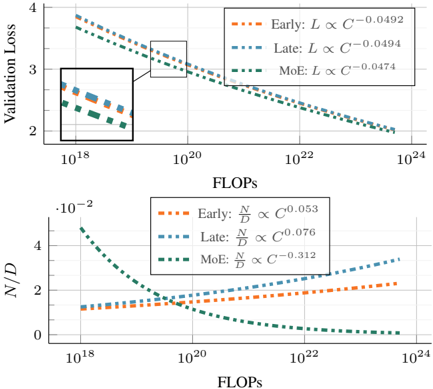
## Chart: Validation Loss vs. FLOPs & N/D vs. FLOPs
### Overview
The image presents two charts, stacked vertically. The top chart displays Validation Loss against FLOPs (Floating Point Operations) for three different training stages: Early, Late, and MoE (Mixture of Experts). The bottom chart shows the ratio of N (number of parameters) to D (dataset size) against FLOPs, also for the same three training stages. Both charts use a logarithmic scale for the x-axis (FLOPs).
### Components/Axes
**Top Chart:**
* **Y-axis:** Validation Loss (scale from approximately 1.5 to 4)
* **X-axis:** FLOPs (logarithmic scale, from approximately 10<sup>18</sup> to 10<sup>24</sup>)
* **Legend:**
* Early: (dashed orange line) L ∝ C<sup>-0.0492</sup>
* Late: (dashed blue line) L ∝ C<sup>-0.0494</sup>
* MoE: (dashed green line) L ∝ C<sup>-0.0474</sup>
* **Inset Box:** A zoomed-in view of the initial portion of the top chart, highlighting the early stages of loss reduction.
**Bottom Chart:**
* **Y-axis:** N/D (ratio of parameters to dataset size, scale from approximately -0.02 to 4)
* **X-axis:** FLOPs (logarithmic scale, from approximately 10<sup>18</sup> to 10<sup>24</sup>)
* **Legend:**
* Early: (dashed orange line) N/D ∝ C<sup>0.053</sup>
* Late: (dashed blue line) N/D ∝ C<sup>0.076</sup>
* MoE: (dashed green line) N/D ∝ C<sup>-0.312</sup>
### Detailed Analysis or Content Details
**Top Chart (Validation Loss vs. FLOPs):**
* **Early (Orange):** The line starts at approximately 3.8 at 10<sup>18</sup> FLOPs and decreases rapidly to around 2.2 at 10<sup>22</sup> FLOPs, then continues to decrease more slowly to approximately 1.8 at 10<sup>24</sup> FLOPs.
* **Late (Blue):** The line begins at approximately 3.5 at 10<sup>18</sup> FLOPs, decreases to around 2.1 at 10<sup>22</sup> FLOPs, and continues to decrease to approximately 1.7 at 10<sup>24</sup> FLOPs.
* **MoE (Green):** The line starts at approximately 3.6 at 10<sup>18</sup> FLOPs, decreases to around 2.3 at 10<sup>22</sup> FLOPs, and continues to decrease to approximately 1.6 at 10<sup>24</sup> FLOPs.
* All three lines exhibit a downward trend, indicating that validation loss decreases as FLOPs increase. The rate of decrease appears to slow down as FLOPs increase.
**Bottom Chart (N/D vs. FLOPs):**
* **Early (Orange):** The line starts at approximately 1.5 at 10<sup>18</sup> FLOPs, decreases to around 0.8 at 10<sup>22</sup> FLOPs, and then increases to approximately 2.5 at 10<sup>24</sup> FLOPs.
* **Late (Blue):** The line begins at approximately 0.5 at 10<sup>18</sup> FLOPs, decreases to around 0.2 at 10<sup>22</sup> FLOPs, and then increases to approximately 1.5 at 10<sup>24</sup> FLOPs.
* **MoE (Green):** The line starts at approximately 0.1 at 10<sup>18</sup> FLOPs, decreases to around -0.1 at 10<sup>22</sup> FLOPs, and then increases to approximately 0.2 at 10<sup>24</sup> FLOPs.
* The Early and Late lines show a U-shaped curve, decreasing initially and then increasing. The MoE line shows a more pronounced decrease followed by a slight increase.
### Key Observations
* The Validation Loss consistently decreases with increasing FLOPs for all three training stages.
* The MoE model consistently exhibits the lowest Validation Loss across all FLOPs values.
* The N/D ratio shows a complex relationship with FLOPs, with Early and Late stages exhibiting a U-shaped curve, while MoE shows a more negative trend initially.
* The inset box in the top chart highlights the initial rapid decrease in validation loss, suggesting a quick learning phase.
### Interpretation
The charts demonstrate the scaling behavior of validation loss and model complexity (N/D ratio) with increasing computational resources (FLOPs) during different training stages (Early, Late, and MoE). The decreasing validation loss with increasing FLOPs indicates that the models are learning and improving their performance. The MoE model consistently outperforms the Early and Late models in terms of validation loss, suggesting that the Mixture of Experts architecture is more effective at utilizing computational resources.
The N/D ratio provides insights into the model's capacity relative to the dataset size. The U-shaped curve observed in the Early and Late stages suggests that initially, increasing model capacity (N) leads to better performance, but beyond a certain point, it can lead to overfitting or diminishing returns. The MoE model's different behavior (initial decrease followed by a slight increase) suggests that it may have a different capacity scaling behavior, potentially due to its ability to selectively activate different experts.
The power law relationships (L ∝ C<sup>-x</sup> and N/D ∝ C<sup>x</sup>) indicate that the validation loss and N/D ratio scale with the model size (C) in a predictable manner. The different exponents (x values) for each training stage suggest that the scaling behavior varies depending on the training phase and architecture. The negative exponent for the MoE model's N/D ratio suggests that increasing model size can actually *decrease* the N/D ratio, potentially indicating a more efficient use of parameters.