## Line Chart: Time Series Data
### Overview
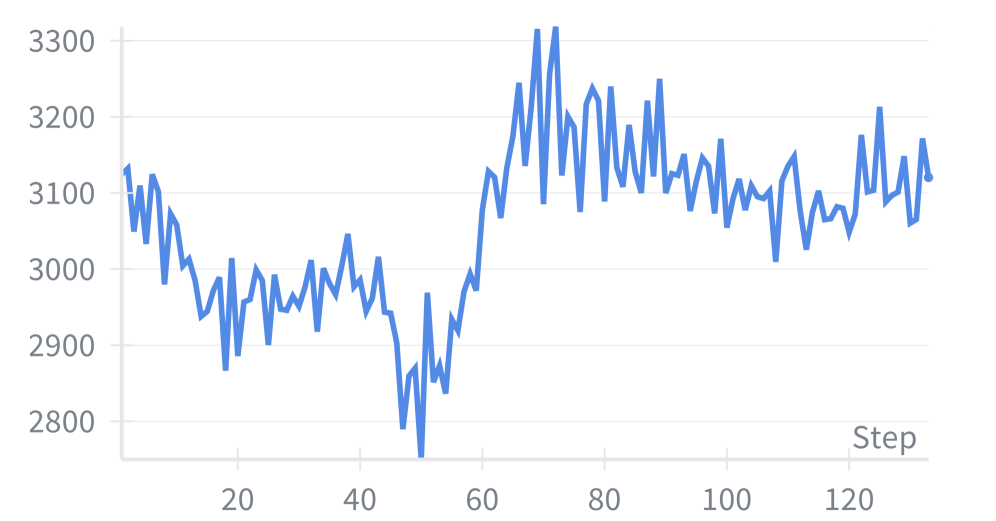
The image is a line chart displaying a time series. The x-axis represents "Step" and the y-axis represents an unspecified value ranging from approximately 2800 to 3300. The blue line shows a fluctuating trend, initially decreasing, then sharply increasing, and finally stabilizing with continued fluctuations.
### Components/Axes
* **X-axis:** Labeled "Step". The axis ranges from approximately 0 to 120, with tick marks at intervals of 20.
* **Y-axis:** The y-axis ranges from 2800 to 3300, with tick marks at intervals of 100.
* **Data Series:** A single blue line represents the data series. There is no legend.
### Detailed Analysis
The blue line representing the data series exhibits the following behavior:
* **Steps 0-55:** The line shows a decreasing trend with fluctuations. It starts around 3120 and decreases to a minimum value of approximately 2750 at step 55.
* **Steps 55-75:** The line shows a sharp increasing trend. It increases from approximately 2750 to a maximum value of approximately 3300 at step 75.
* **Steps 75-125:** The line shows a relatively stable trend with fluctuations. It fluctuates between approximately 3050 and 3250.
Specific data points (approximate):
* Step 0: 3120
* Step 20: 2950
* Step 40: 3000
* Step 55: 2750
* Step 75: 3300
* Step 90: 3150
* Step 110: 3080
* Step 125: 3150
### Key Observations
* The data series experiences a significant drop before step 60.
* A sharp increase occurs between steps 60 and 75.
* The data stabilizes after step 75, fluctuating within a narrower range.
### Interpretation
The chart illustrates a time series with three distinct phases: a decline, a rapid increase, and a stabilization period. The initial decline might represent a period of instability or learning, the rapid increase could indicate a significant event or intervention, and the stabilization suggests a state of equilibrium or convergence. Without further context, the specific meaning of the "Step" and the y-axis value remains unclear, but the chart clearly demonstrates a dynamic process with notable transitions.