\n
## Line Chart: Data Trend Over Steps
### Overview
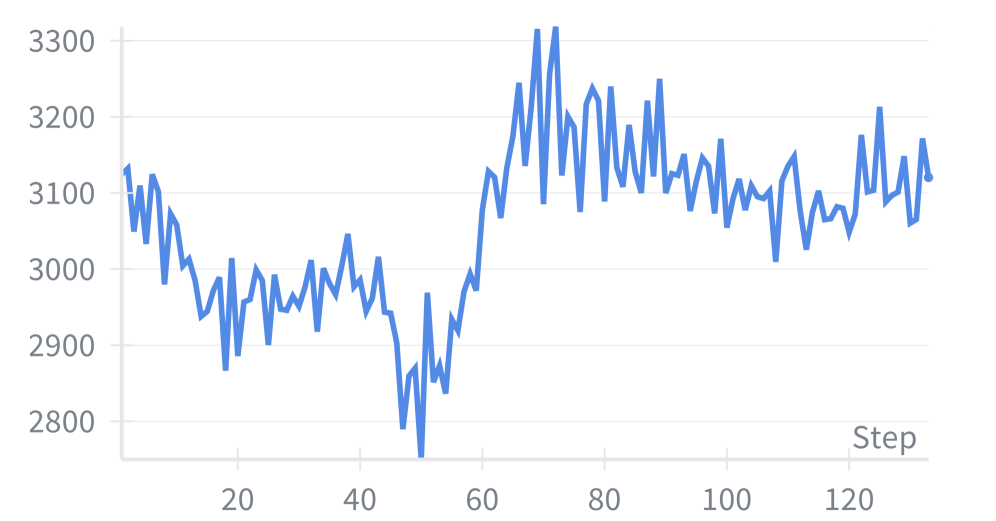
The image presents a line chart illustrating a data trend over a series of steps. The y-axis represents a numerical value ranging from approximately 2800 to 3300, while the x-axis represents "Step" ranging from 0 to 120. The chart shows a fluctuating line, indicating changes in the data value as the step number increases.
### Components/Axes
* **X-axis:** Labeled "Step", with markers at intervals of 10 from 0 to 120.
* **Y-axis:** Ranges from approximately 2800 to 3300, with no explicit label. The scale is linear.
* **Data Series:** A single blue line representing the data trend.
* **Legend:** None.
### Detailed Analysis
The blue line begins at approximately 3200 at Step 0.
* **Steps 0-20:** The line exhibits a downward trend, decreasing from approximately 3200 to around 2900. There are fluctuations within this range.
* **Steps 20-40:** The line continues to fluctuate, remaining generally between 2900 and 3000, with some minor increases and decreases.
* **Steps 40-60:** A significant upward trend is observed, with the line increasing from approximately 2850 to a peak of around 3250.
* **Steps 60-80:** The line experiences high-frequency fluctuations, oscillating between approximately 3100 and 3300.
* **Steps 80-100:** The line continues to fluctuate, generally remaining between 3050 and 3200.
* **Steps 100-120:** The line shows a slight upward trend, ending at approximately 3180.
Approximate data points:
* Step 0: 3200
* Step 10: 3050
* Step 20: 2900
* Step 30: 2950
* Step 40: 2900
* Step 50: 2850
* Step 60: 3100
* Step 70: 3250
* Step 80: 3200
* Step 90: 3100
* Step 100: 3050
* Step 110: 3100
* Step 120: 3180
### Key Observations
* The data exhibits significant volatility, with frequent fluctuations throughout the entire range of steps.
* There is a clear upward trend between Steps 40 and 60.
* The data appears to stabilize somewhat between Steps 80 and 120, although fluctuations persist.
* The lowest value is observed around Step 50, at approximately 2850.
* The highest value is observed around Step 70, at approximately 3250.
### Interpretation
The chart suggests a dynamic process where the measured value changes over time (represented by "Step"). The initial decline could represent a settling period or initial decrease in a variable. The subsequent increase indicates a growth or recovery phase. The high-frequency fluctuations between Steps 60 and 120 suggest a system operating near a stable point, with constant adjustments and minor variations. The lack of context makes it difficult to determine the specific meaning of the data, but it could represent any time-series data, such as stock prices, sensor readings, or process variables. The data does not show any clear long-term trend beyond the initial decline and recovery. The fluctuations suggest a system that is sensitive to external factors or internal noise.