## Line Graph: Step Value Fluctuations Over Time
### Overview
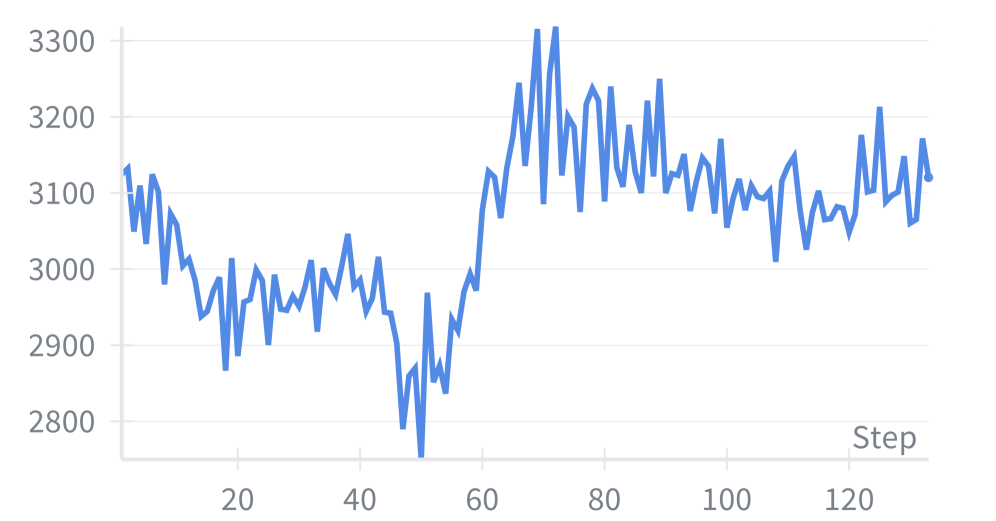
The image depicts a line graph illustrating the fluctuations of a numerical value (y-axis) across sequential steps (x-axis). The blue line exhibits significant volatility, with sharp rises and falls, suggesting dynamic changes in the measured variable over time.
### Components/Axes
- **X-axis (Horizontal)**: Labeled "Step," ranging from 0 to 120 in increments of 20. Positioned at the bottom of the graph.
- **Y-axis (Vertical)**: Numerical values from 2800 to 3300, increasing in increments of 100. Positioned on the left side.
- **Legend**: Located in the bottom-right corner, labeled "Step" with a blue line indicator.
- **Line**: A single blue line representing the data series, with no additional legends or categories.
### Detailed Analysis
- **Initial Trend (Steps 0–40)**: The line starts at approximately 3100, declines steadily to ~2900 by step 20, then fluctuates between 2900–3000 before dropping sharply to **~2800 at step 40**.
- **Recovery Phase (Steps 40–60)**: A rapid ascent begins at step 40, peaking at **~3300 by step 60**, with jagged oscillations indicating instability.
- **Post-Peak Behavior (Steps 60–120)**: The line declines to ~3100 by step 80, stabilizes between 3000–3100, and ends at ~3100 at step 120, with minor fluctuations.
### Key Observations
1. **Sharp Drop at Step 40**: A critical anomaly where the value plummets to the graph’s lowest point (~2800), suggesting an external event or system failure.
2. **Peak at Step 60**: The highest recorded value (~3300) coincides with step 60, followed by a sustained decline.
3. **Volatility**: Frequent oscillations (e.g., between 3000–3200 post-step 60) indicate instability or reactive adjustments.
### Interpretation
The data suggests a system or process experiencing a critical failure or intervention at step 40, followed by recovery efforts that temporarily overshoot the baseline. The subsequent stabilization implies corrective measures were implemented, though residual fluctuations hint at unresolved underlying issues. The peak at step 60 may reflect overcompensation or a secondary event. This pattern could represent real-world scenarios such as financial market crashes, engineering system responses, or biological stress responses, where external shocks trigger cascading adjustments.