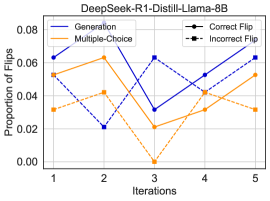
## Line Chart: DeepSeek-R1-Distill-Llama-8B
### Overview
The image is a line chart comparing the proportion of flips across iterations for different methods: Generation and Multiple-Choice, further broken down by Correct Flip and Incorrect Flip. The chart shows how these proportions change over five iterations.
### Components/Axes
* **Title:** DeepSeek-R1-Distill-Llama-8B
* **X-axis:** Iterations, with markers at 1, 2, 3, 4, and 5.
* **Y-axis:** Proportion of Flips, ranging from 0.00 to 0.08, with increments of 0.02.
* **Legend (top-left):**
* **Blue solid line:** Generation
* **Orange solid line:** Multiple-Choice
* **Black solid line with circle markers:** Correct Flip
* **Black dashed line with square markers:** Incorrect Flip
### Detailed Analysis
* **Generation (Blue solid line):** Starts at approximately 0.063 at iteration 1, decreases to about 0.021 at iteration 2, increases to approximately 0.063 at iteration 3, decreases to about 0.043 at iteration 4, and increases again to approximately 0.063 at iteration 5.
* **Multiple-Choice (Orange solid line):** Starts at approximately 0.053 at iteration 1, increases to about 0.063 at iteration 2, decreases to approximately 0.00 at iteration 3, increases to about 0.03 at iteration 4, and increases again to approximately 0.053 at iteration 5.
* **Correct Flip (Black solid line with circle markers):** Starts at approximately 0.063 at iteration 1, decreases to about 0.021 at iteration 2, increases to approximately 0.063 at iteration 3, decreases to about 0.043 at iteration 4, and increases again to approximately 0.063 at iteration 5.
* **Incorrect Flip (Black dashed line with square markers):** Starts at approximately 0.053 at iteration 1, increases to about 0.042 at iteration 2, decreases to approximately 0.00 at iteration 3, increases to about 0.03 at iteration 4, and increases again to approximately 0.032 at iteration 5.
### Key Observations
* The "Generation" and "Correct Flip" lines are identical, suggesting a direct correlation or identical data.
* The "Multiple-Choice" and "Incorrect Flip" lines are identical, suggesting a direct correlation or identical data.
* Both pairs of lines show a similar trend: a decrease from iteration 1 to iteration 2, a significant drop at iteration 3, and then a gradual increase towards iteration 5.
### Interpretation
The chart compares the proportion of flips for two methods, "Generation" and "Multiple-Choice," across five iterations. The data suggests that the "Generation" method is directly related to "Correct Flips," and the "Multiple-Choice" method is directly related to "Incorrect Flips." The similar trends observed in both pairs of lines indicate that the proportion of flips is influenced by the iteration number, with a notable dip at iteration 3. This could be due to a change in the model or data at that specific iteration. The data implies that the model's performance, as measured by the proportion of flips, varies across iterations, and the choice of method (Generation vs. Multiple-Choice) is directly linked to the correctness of the flips.