\n
## Line Chart: DeepSeek-R1-Distill-Llama-8B Performance
### Overview
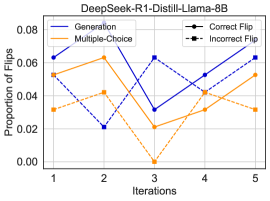
This image presents a line chart illustrating the proportion of flips across different iterations for various methods: Generation, Multiple-Choice, Correct Flip, and Incorrect Flip. The chart appears to track the performance of a model (DeepSeek-R1-Distill-Llama-8B) over five iterations.
### Components/Axes
* **Title:** DeepSeek-R1-Distill-Llama-8B
* **X-axis:** Iterations (labeled 1 to 5)
* **Y-axis:** Proportion of Flips (scale from 0.00 to 0.08)
* **Legend:** Located in the top-right corner.
* Generation (Blue solid line)
* Multiple-Choice (Orange solid line)
* Correct Flip (Black dashed line)
* Incorrect Flip (Black dotted line)
* **Gridlines:** Present to aid in reading values.
### Detailed Analysis
The chart displays four distinct lines representing the proportion of flips for each method across the five iterations.
* **Generation (Blue Line):** The line generally slopes upward, indicating an increasing proportion of flips.
* Iteration 1: Approximately 0.064
* Iteration 2: Approximately 0.052
* Iteration 3: Approximately 0.032
* Iteration 4: Approximately 0.045
* Iteration 5: Approximately 0.066
* **Multiple-Choice (Orange Line):** This line exhibits more fluctuation.
* Iteration 1: Approximately 0.054
* Iteration 2: Approximately 0.064
* Iteration 3: Approximately 0.018
* Iteration 4: Approximately 0.028
* Iteration 5: Approximately 0.052
* **Correct Flip (Black Dashed Line):** The line shows a decreasing trend initially, then a slight increase.
* Iteration 1: Approximately 0.052
* Iteration 2: Approximately 0.022
* Iteration 3: Approximately 0.018
* Iteration 4: Approximately 0.042
* Iteration 5: Approximately 0.058
* **Incorrect Flip (Black Dotted Line):** This line generally increases over the iterations.
* Iteration 1: Approximately 0.028
* Iteration 2: Approximately 0.042
* Iteration 3: Approximately 0.026
* Iteration 4: Approximately 0.056
* Iteration 5: Approximately 0.062
### Key Observations
* The "Generation" method shows a consistent upward trend in the proportion of flips, suggesting it becomes more prone to changes over iterations.
* The "Multiple-Choice" method exhibits the most volatility, with a significant drop in flips at iteration 3.
* "Correct Flip" initially decreases, then increases, indicating a potential initial improvement followed by a regression.
* "Incorrect Flip" shows a steady increase, suggesting a growing number of incorrect changes over iterations.
### Interpretation
The data suggests that the DeepSeek-R1-Distill-Llama-8B model's behavior changes over iterations, as indicated by the varying proportions of flips. The increasing trend in "Generation" flips could indicate a growing instability or sensitivity to input changes. The sharp drop in "Multiple-Choice" flips at iteration 3 is a notable anomaly that warrants further investigation – it could be due to a specific input or a change in the model's internal state. The increasing "Incorrect Flip" proportion is concerning, as it suggests the model is becoming more likely to make errors. The interplay between "Correct Flip" and "Incorrect Flip" is also interesting; the initial decrease in "Correct Flip" followed by an increase could indicate a period of learning followed by overfitting or a shift in the model's focus. Overall, the chart provides valuable insights into the model's dynamic behavior and potential areas for improvement.