## Line Chart: DeepSeek-R1-Distill-Llama-8B Performance Across Iterations
### Overview
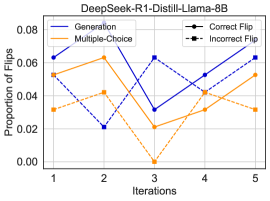
This image is a line chart titled "DeepSeek-R1-Distill-Llama-8B". It plots the "Proportion of Flips" against "Iterations" for two distinct methods or conditions, labeled "Generation" and "Multiple-Choice". Each method's data is further broken down into "Correct Flip" and "Incorrect Flip" categories, represented by different line styles and markers. The chart appears to track the stability or error rate of a model's outputs over sequential iterations.
### Components/Axes
* **Chart Title:** "DeepSeek-R1-Distill-Llama-8B" (centered at the top).
* **Y-Axis:**
* **Label:** "Proportion of Flips" (rotated vertically on the left).
* **Scale:** Linear scale from 0.00 to 0.08, with major tick marks at 0.00, 0.02, 0.04, 0.06, and 0.08.
* **X-Axis:**
* **Label:** "Iterations" (centered at the bottom).
* **Scale:** Discrete integer scale from 1 to 5.
* **Legend:** Positioned at the top center of the plot area.
* **Line Styles & Colors:**
* **Generation:** Solid blue line.
* **Multiple-Choice:** Dashed orange line.
* **Markers (for Flip Type):**
* **Correct Flip:** Circle marker (●).
* **Incorrect Flip:** Square marker (■).
* **Interpretation:** The chart displays four data series by combining the method (line style/color) with the flip type (marker). For example, the solid blue line with circle markers represents the proportion of "Correct Flips" for the "Generation" method.
### Detailed Analysis
The chart tracks four series across 5 iterations. Values are approximate based on visual inspection of the chart.
**1. Generation - Correct Flip (Solid Blue Line, Circle Markers)**
* **Trend:** Shows significant volatility. Starts high, dips, peaks sharply, then declines before rising again.
* **Data Points (Approx.):**
* Iteration 1: ~0.055
* Iteration 2: ~0.020
* Iteration 3: ~0.063 (Peak)
* Iteration 4: ~0.045
* Iteration 5: ~0.065
**2. Generation - Incorrect Flip (Solid Blue Line, Square Markers)**
* **Trend:** Follows a similar volatile pattern to its "Correct Flip" counterpart but with generally lower values after the first iteration.
* **Data Points (Approx.):**
* Iteration 1: ~0.055 (Same starting point as Correct Flip)
* Iteration 2: ~0.020
* Iteration 3: ~0.030
* Iteration 4: ~0.055
* Iteration 5: ~0.030
**3. Multiple-Choice - Correct Flip (Dashed Orange Line, Circle Markers)**
* **Trend:** Exhibits a dramatic "V" shape. Rises to a peak, plummets to near zero, then recovers.
* **Data Points (Approx.):**
* Iteration 1: ~0.030
* Iteration 2: ~0.045 (Peak)
* Iteration 3: ~0.000 (Trough)
* Iteration 4: ~0.030
* Iteration 5: ~0.055
**4. Multiple-Choice - Incorrect Flip (Dashed Orange Line, Square Markers)**
* **Trend:** Shows a general downward trend with a mid-point dip, followed by a slight recovery.
* **Data Points (Approx.):**
* Iteration 1: ~0.050
* Iteration 2: ~0.040
* Iteration 3: ~0.010
* Iteration 4: ~0.030
* Iteration 5: ~0.030
### Key Observations
1. **High Volatility at Iteration 3:** This iteration is a critical point. The "Generation" method's "Correct Flip" proportion spikes to its maximum, while the "Multiple-Choice" method's "Correct Flip" proportion crashes to its minimum (~0.00). This suggests a major divergence in behavior between the two methods at this stage.
2. **Convergence at Start and End:** At Iteration 1, the "Generation" method's correct and incorrect flip proportions are identical (~0.055). By Iteration 5, the "Multiple-Choice - Correct Flip" series (~0.055) surpasses all others, ending as the highest value.
3. **Method Comparison:** The "Generation" method (blue lines) generally maintains higher flip proportions than "Multiple-Choice" (orange lines) for most of the chart, except for the final iteration where "Multiple-Choice - Correct Flip" takes the lead.
4. **Flip Type Relationship:** For the "Generation" method, the correct and incorrect flip lines often move in tandem (e.g., both dip at Iteration 2). For "Multiple-Choice", their paths are more divergent, especially at Iteration 3.
### Interpretation
This chart likely visualizes the stability of a distilled language model's (DeepSeek-R1-Distill-Llama-8B) outputs when subjected to iterative refinement or testing. A "flip" probably refers to a change in the model's answer or output between iterations.
* **What the data suggests:** The "Generation" method appears to be more consistently active (higher overall flip rates) but volatile. The "Multiple-Choice" method shows a more dramatic failure mode at Iteration 3, where correct flips almost vanish, indicating a potential point of instability or a specific challenge in the task at that stage. Its recovery by Iteration 5 suggests resilience or adaptation.
* **How elements relate:** The direct comparison of two methods (Generation vs. Multiple-Choice) across the same iterative process allows for an evaluation of which approach is more stable or reliable. The breakdown into correct vs. incorrect flips adds a layer of quality assessment—not just whether the output changes, but whether the change is an improvement.
* **Notable anomaly:** The near-zero value for "Multiple-Choice - Correct Flip" at Iteration 3 is the most striking anomaly. This could indicate a systematic error, a particularly difficult test case, or a phase where the model's outputs became temporarily locked in an incorrect state before correcting course.
* **Underlying purpose:** This analysis is crucial for understanding model behavior in iterative settings (like chain-of-thought reasoning or self-correction). It helps identify which methods are prone to erratic changes and at which stages they are most vulnerable, guiding improvements in model training or prompting strategies.