## Line Chart: DeepSeek-R1-Distill-Llama-8B
### Overview
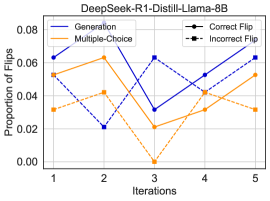
The chart illustrates the proportion of flips (correct and incorrect) for two methods—**Generation** and **Multiple-Choice**—across five iterations. The y-axis represents the proportion of flips (0.00 to 0.08), while the x-axis denotes iterations (1 to 5). Two lines are plotted: a blue line for **Generation** and an orange line for **Multiple-Choice**, with data points marked as filled (correct flips) and open (incorrect flips).
### Components/Axes
- **Y-axis**: "Proportion of Flips" (0.00 to 0.08, increments of 0.02).
- **X-axis**: "Iterations" (1 to 5).
- **Legend**:
- **Blue line**: "Generation" (filled circles for correct flips, open circles for incorrect flips).
- **Orange line**: "Multiple-Choice" (filled circles for correct flips, open circles for incorrect flips).
### Detailed Analysis
- **Generation (Blue Line)**:
- Iteration 1: ~0.06 (filled circle, correct flip).
- Iteration 2: ~0.08 (filled circle, correct flip).
- Iteration 3: ~0.02 (filled circle, correct flip).
- Iteration 4: ~0.05 (filled circle, correct flip).
- Iteration 5: ~0.06 (filled circle, correct flip).
- **Multiple-Choice (Orange Line)**:
- Iteration 1: ~0.04 (open circle, incorrect flip).
- Iteration 2: ~0.06 (open circle, incorrect flip).
- Iteration 3: ~0.00 (open circle, incorrect flip).
- Iteration 4: ~0.03 (open circle, incorrect flip).
- Iteration 5: ~0.05 (open circle, incorrect flip).
### Key Observations
1. **Generation Line**:
- Peaks at iteration 2 (~0.08) and reaches a trough at iteration 3 (~0.02).
- Shows a general upward trend after iteration 3, stabilizing at ~0.06 by iteration 5.
2. **Multiple-Choice Line**:
- Drops sharply to 0.00 at iteration 3, then increases to ~0.05 by iteration 5.
- Exhibits a V-shaped pattern with a minimum at iteration 3.
### Interpretation
The data suggests that the **Generation** method experiences significant fluctuations in correct flips, with a notable dip at iteration 3. The **Multiple-Choice** method shows a dramatic reduction in incorrect flips at iteration 3, followed by a recovery. This could indicate that the model's performance for Multiple-Choice improved after iteration 3, while Generation's performance stabilized. The sharp drop in Multiple-Choice at iteration 3 might reflect a model adjustment or a change in data distribution. The trends highlight the dynamic nature of the model's behavior across iterations, with potential implications for optimization strategies.