## Diagram: Reaction Network
### Overview
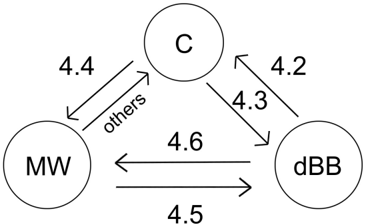
The image shows a diagram of a reaction network involving three components: C, MW, and dBB. Arrows indicate the direction of reactions, with numerical labels indicating reaction rates or constants.
### Components/Axes
* **Nodes:**
* C (Central node, top)
* MW (Left node)
* dBB (Right node)
* **Edges (Arrows):**
* C -> MW, labeled "4.4"
* MW -> C, labeled "others"
* C -> dBB, labeled "4.3"
* dBB -> C, labeled "4.2"
* MW -> dBB, labeled "4.5"
* dBB -> MW, labeled "4.6"
### Detailed Analysis or ### Content Details
The diagram illustrates a network of reversible and irreversible reactions between the three components. The numerical labels associated with each arrow likely represent rate constants or other parameters quantifying the reaction kinetics.
* **Reaction C -> MW:** Rate constant/parameter is 4.4.
* **Reaction MW -> C:** Rate constant/parameter is labeled "others".
* **Reaction C -> dBB:** Rate constant/parameter is 4.3.
* **Reaction dBB -> C:** Rate constant/parameter is 4.2.
* **Reaction MW -> dBB:** Rate constant/parameter is 4.5.
* **Reaction dBB -> MW:** Rate constant/parameter is 4.6.
### Key Observations
* The component "C" appears to be a central intermediate, reacting with both "MW" and "dBB".
* The reaction from "MW" to "C" is labeled "others", suggesting it might involve multiple pathways or reactants not explicitly shown.
* All other reactions are represented by single arrows with numerical labels.
### Interpretation
The diagram represents a simplified model of a chemical or biological reaction network. The nodes represent different chemical species or states, and the arrows represent the reactions that transform one species into another. The numerical labels provide quantitative information about the reaction rates, which can be used to simulate and analyze the behavior of the network. The "others" label suggests that the model is not fully comprehensive and that some reactions may be more complex than represented.