\n
## Diagram: Relationship Network
### Overview
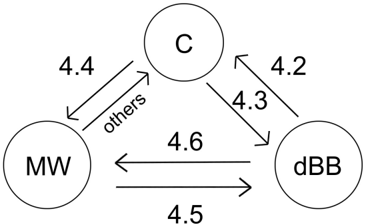
The image depicts a network diagram showing relationships between three entities: "C", "MW", and "dBB". The relationships are represented by lines connecting the entities, with numerical values associated with each line indicating a strength or distance. The diagram appears to illustrate some form of interaction or correlation between these three elements.
### Components/Axes
The diagram consists of three circular nodes labeled "C" (top-center), "MW" (left), and "dBB" (right). Lines connect each pair of nodes. Each line has a numerical value associated with it. One line is labeled "others".
### Detailed Analysis or Content Details
* **C - MW:** The line connecting "C" and "MW" has a value of 4.4. The arrow points from "MW" to "C". The line is also labeled "others".
* **C - dBB:** Two lines connect "C" and "dBB". One has a value of 4.2, with the arrow pointing from "dBB" to "C". The other has a value of 4.3, with the arrow pointing from "C" to "dBB".
* **MW - dBB:** Two lines connect "MW" and "dBB". One has a value of 4.6, with the arrow pointing from "C" to "dBB". The other has a value of 4.5, with the arrow pointing from "dBB" to "MW".
### Key Observations
The diagram shows a fully connected network where each entity is directly related to the other two. The values associated with the connections are all within a narrow range (4.2 to 4.6), suggesting a relatively consistent level of interaction or correlation. The presence of two lines between "C" and "dBB", and "MW" and "dBB" suggests a more complex relationship between these pairs. The label "others" on the "C-MW" line is ambiguous and requires further context.
### Interpretation
The diagram likely represents a correlation or interaction network between three variables or entities. The numerical values could represent the strength of the relationship, a distance metric, or some other quantitative measure. The fact that all connections have similar values suggests that the relationships are roughly equal in strength. The "others" label on the "C-MW" connection implies that there are other factors influencing this relationship that are not explicitly represented in the diagram. Without additional context, it is difficult to determine the specific meaning of the diagram. It could represent, for example, a network of gene interactions, a social network, or a system of dependencies in a complex process. The bidirectional nature of some connections suggests a reciprocal relationship between the entities.