## Causal Diagram: Confounding and Mediation
### Overview
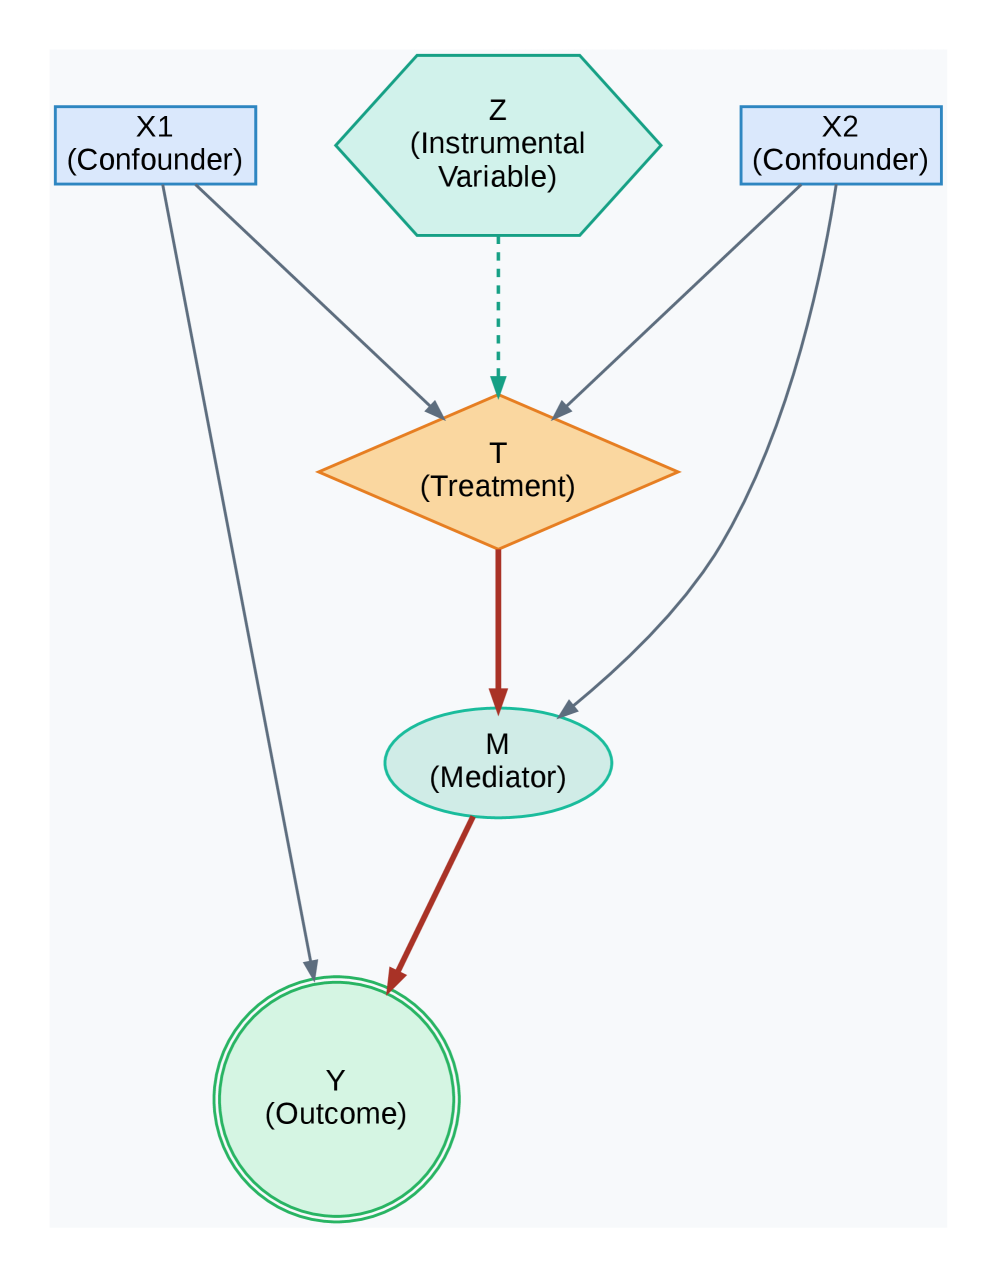
The image is a causal diagram illustrating relationships between variables, including confounders, an instrumental variable, treatment, a mediator, and an outcome. The diagram uses shapes and arrows to represent the variables and their relationships.
### Components/Axes
* **Shapes:**
* Rectangles: Represent confounders (X1, X2).
* Hexagon: Represents the instrumental variable (Z).
* Diamond: Represents the treatment (T).
* Oval: Represents the mediator (M).
* Double Circle: Represents the outcome (Y).
* **Arrows:** Indicate the direction of influence or causal relationship.
* Solid Arrows: Represent direct causal effects.
* Dashed Arrows: Represent a potential or weaker causal effect.
* **Variables:**
* X1: Confounder
* X2: Confounder
* Z: Instrumental Variable
* T: Treatment
* M: Mediator
* Y: Outcome
### Detailed Analysis or Content Details
* **X1 (Confounder):** A rectangle in the top-left corner. It has arrows pointing towards both T (Treatment) and Y (Outcome).
* **X2 (Confounder):** A rectangle in the top-right corner. It has arrows pointing towards both T (Treatment) and Y (Outcome).
* **Z (Instrumental Variable):** A hexagon at the top-center. It has a dashed arrow pointing towards T (Treatment).
* **T (Treatment):** A diamond shape in the center. It receives arrows from X1, X2, and Z. It has a solid arrow pointing towards M (Mediator).
* **M (Mediator):** An oval shape below T. It receives an arrow from T and has an arrow pointing towards Y (Outcome).
* **Y (Outcome):** A double circle at the bottom. It receives arrows from X1, X2, and M.
**Arrow Details:**
* X1 -> T: Solid gray arrow.
* X1 -> Y: Solid gray arrow.
* X2 -> T: Solid gray arrow.
* X2 -> Y: Solid gray arrow.
* Z -> T: Dashed teal arrow.
* T -> M: Solid red arrow.
* M -> Y: Solid red arrow.
### Key Observations
* Confounders X1 and X2 influence both the treatment T and the outcome Y.
* The instrumental variable Z influences the treatment T but is assumed to be independent of the outcome Y except through its effect on T.
* The treatment T influences the mediator M, which in turn influences the outcome Y.
### Interpretation
The diagram illustrates a causal model where the relationship between a treatment (T) and an outcome (Y) is influenced by confounders (X1, X2) and mediated by a variable M. The instrumental variable Z is used to estimate the causal effect of T on Y by exploiting its influence on T. The diagram highlights the importance of considering confounding and mediation when analyzing causal relationships. The dashed line from Z to T indicates a potential or weaker causal effect, possibly representing an indirect or probabilistic influence. The red arrows from T to M and M to Y suggest a direct and potentially strong influence of the treatment on the mediator and the mediator on the outcome. The gray arrows from X1 and X2 to T and Y indicate confounding effects, where these variables influence both the treatment and the outcome, potentially biasing the estimated effect of T on Y.