\n
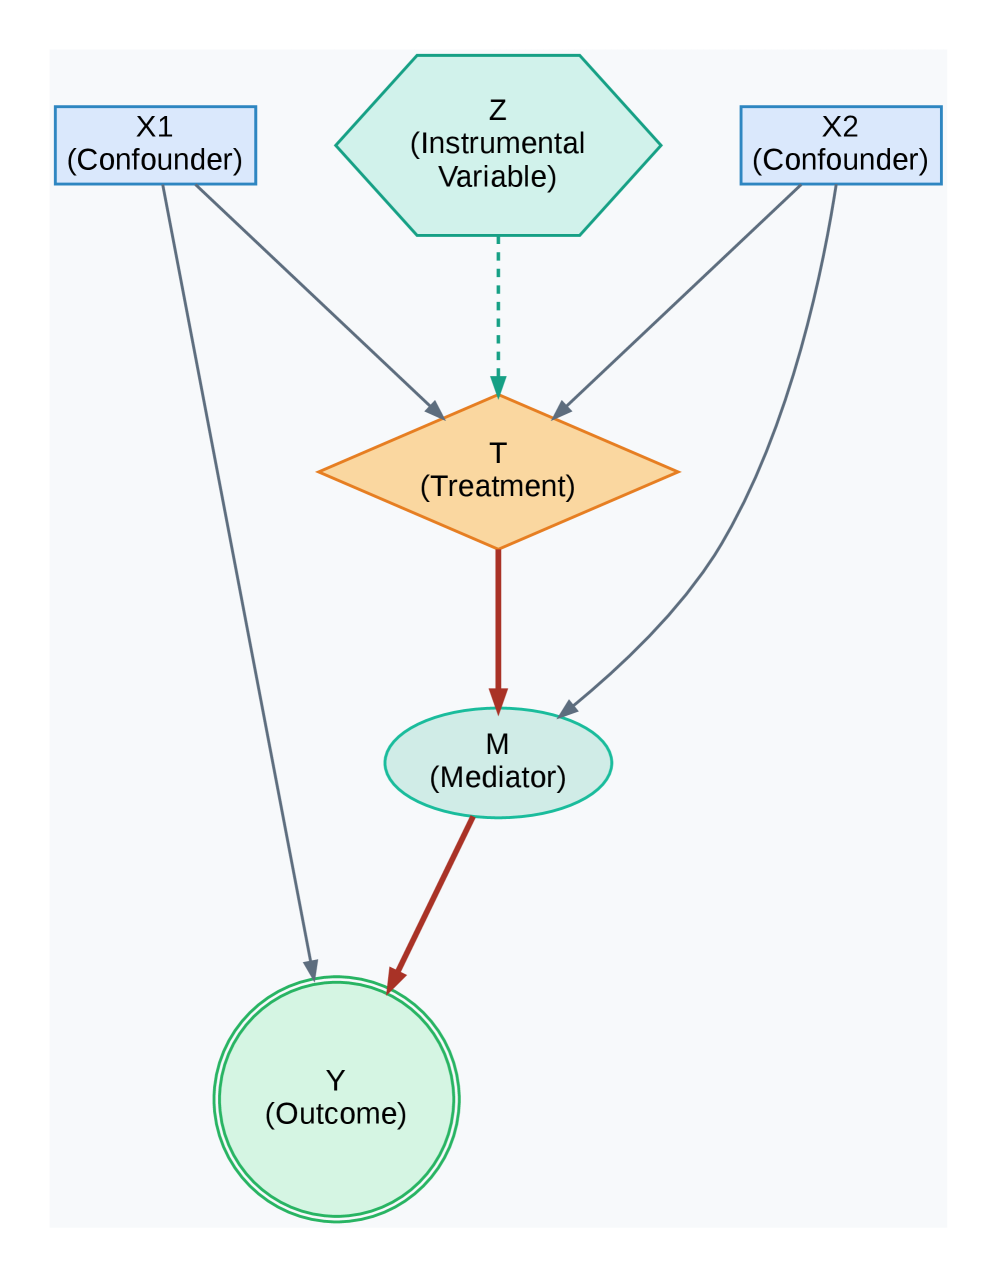
## Diagram: Causal Diagram - Mediation Analysis
### Overview
The image depicts a directed acyclic graph (DAG) illustrating a mediation analysis model. The diagram shows the relationships between confounders, an instrumental variable, treatment, mediator, and outcome. The shapes of the nodes indicate the type of variable, and arrows indicate causal relationships.
### Components/Axes
The diagram consists of the following components:
* **Nodes:**
* X1 (Confounder) - Light blue hexagon, positioned top-left.
* Z (Instrumental Variable) - Light blue hexagon, positioned top-center.
* X2 (Confounder) - Light blue hexagon, positioned top-right.
* T (Treatment) - Orange diamond, positioned center-top.
* M (Mediator) - Light green pentagon, positioned center.
* Y (Outcome) - Light green circle, positioned bottom-center.
* **Arrows:** Represent causal relationships between the nodes.
* X1 -> T (Solid black arrow)
* X1 -> M (Solid black arrow)
* X2 -> T (Solid black arrow)
* X2 -> M (Solid black arrow)
* Z -> T (Dashed black arrow)
* T -> M (Solid black arrow)
* M -> Y (Solid red arrow)
* T -> Y (Solid black arrow)
### Detailed Analysis or Content Details
The diagram illustrates a causal pathway where confounders (X1 and X2) influence both the treatment (T) and the mediator (M). The instrumental variable (Z) influences only the treatment (T). The treatment (T) influences both the mediator (M) and the outcome (Y). The mediator (M) influences the outcome (Y). The solid arrows represent direct causal effects, while the dashed arrow represents the influence of the instrumental variable.
### Key Observations
* The diagram highlights the potential for confounding in the relationship between treatment and outcome.
* The instrumental variable is shown to only affect the treatment, not the outcome directly, making it a valid instrument for causal inference.
* The mediator variable is positioned between the treatment and outcome, indicating its role in transmitting the effect of the treatment to the outcome.
* The red arrow from M to Y is visually distinct, potentially emphasizing the importance of the mediation pathway.
### Interpretation
This diagram represents a common setup for mediation analysis, a statistical technique used to understand the mechanisms through which an independent variable (treatment) affects a dependent variable (outcome). The diagram suggests that the effect of the treatment on the outcome may be partially or fully explained by its effect on the mediator. The inclusion of confounders (X1 and X2) acknowledges that other factors may also influence both the treatment and the outcome, potentially distorting the observed relationship. The instrumental variable (Z) is used to address potential confounding and estimate the causal effect of the treatment on the outcome. The diagram is a visual representation of the assumptions underlying mediation analysis, and it helps to clarify the relationships between the variables involved. The use of different shapes for each variable type (hexagon for confounders, diamond for treatment, pentagon for mediator, circle for outcome) aids in understanding the model. The dashed line for the instrumental variable is a visual cue to indicate its unique role in the causal pathway.