## Causal Diagram: Instrumental Variable with Mediation
### Overview
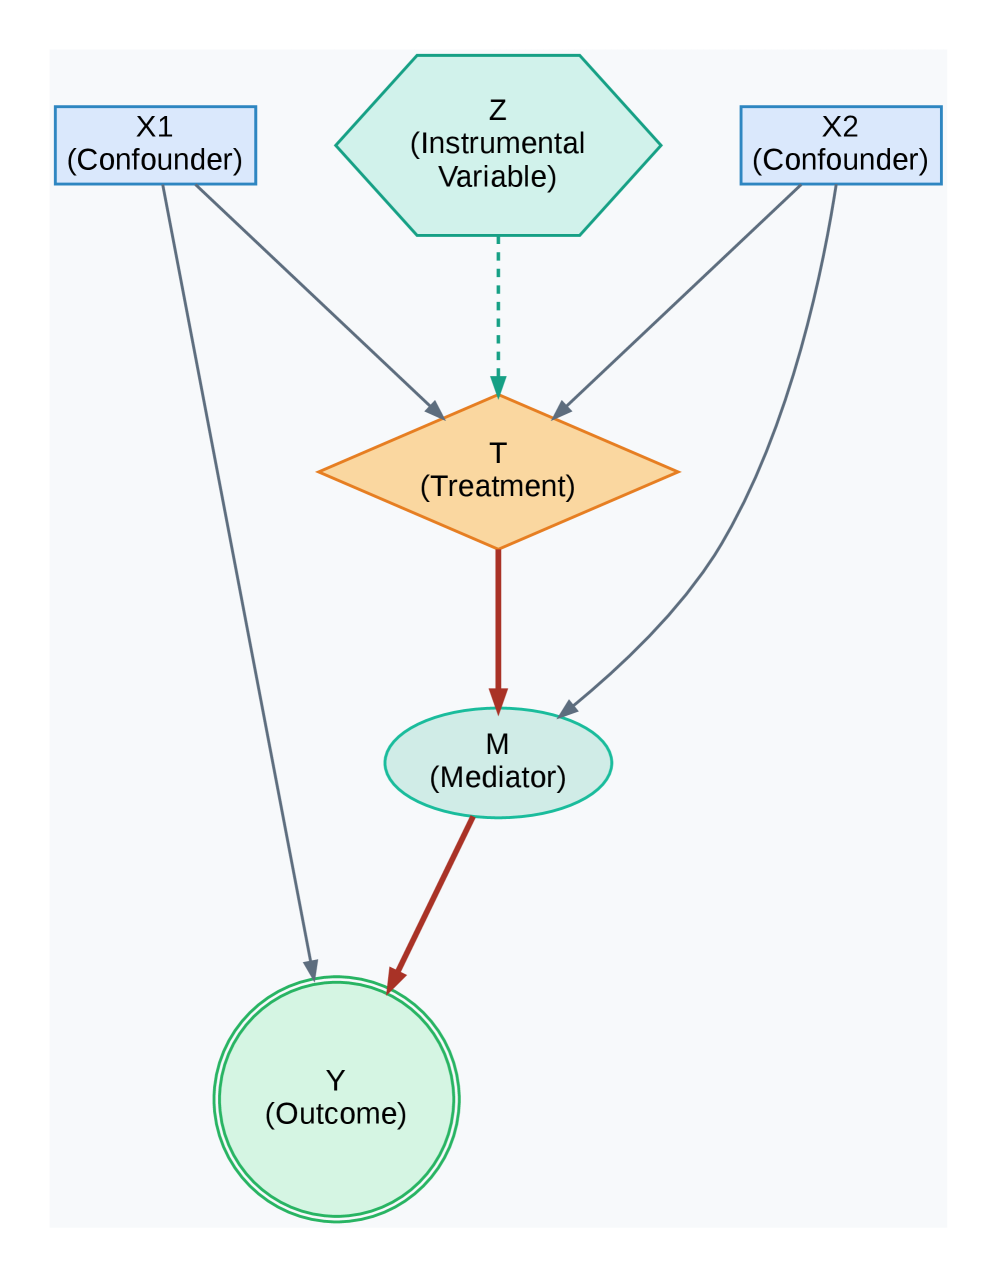
The image displays a directed acyclic graph (DAG) illustrating a causal model. It depicts the relationships between several variables: two confounders (X1, X2), an instrumental variable (Z), a treatment (T), a mediator (M), and an outcome (Y). The diagram uses distinct shapes and colors to denote different variable types and employs arrows (solid and dashed) to represent hypothesized causal pathways.
### Components/Axes
The diagram is composed of six labeled nodes connected by directional arrows. There are no traditional axes, as this is a conceptual model, not a data chart.
**Nodes (Variables):**
1. **X1 (Confounder):** Located in the top-left corner. Represented by a light blue rectangle.
2. **X2 (Confounder):** Located in the top-right corner. Represented by a light blue rectangle.
3. **Z (Instrumental Variable):** Located in the top-center. Represented by a teal hexagon.
4. **T (Treatment):** Located in the center. Represented by an orange diamond.
5. **M (Mediator):** Located directly below T. Represented by a teal oval.
6. **Y (Outcome):** Located at the bottom-center. Represented by a light green circle with a double outline.
**Arrows (Causal Pathways):**
* **Solid Grey Arrows:**
* From X1 to T.
* From X1 to Y.
* From X2 to T.
* From X2 to Y.
* From X2 to M.
* **Dashed Teal Arrow:**
* From Z to T.
* **Solid Red Arrows:**
* From T to M.
* From M to Y.
### Detailed Analysis
The diagram explicitly defines the role of each variable and maps the proposed causal flows.
* **Confounders (X1, X2):** These variables are shown to influence both the Treatment (T) and the Outcome (Y) directly, which is the classic definition of a confounder. X2 also has a direct path to the Mediator (M).
* **Instrumental Variable (Z):** This variable is connected *only* to the Treatment (T) via a dashed arrow. The dashed line may indicate a specific assumption, such as a weaker or conditional relationship, or simply differentiate it visually. Crucially, Z has no direct path to the Outcome (Y) or the Mediator (M), satisfying the core exclusion restriction assumption for an instrument.
* **Treatment (T):** This is the central intervention or exposure variable. It is influenced by the confounders (X1, X2) and the instrumental variable (Z). It then influences the Outcome (Y) through two pathways: a direct path (not shown) and an indirect path via the Mediator (M).
* **Mediator (M):** This variable sits on the causal pathway between Treatment (T) and Outcome (Y). The red arrows from T to M and M to Y highlight this specific mediated effect.
* **Outcome (Y):** The final variable of interest. It is influenced directly by the confounders (X1, X2) and the mediator (M). The double circle around Y emphasizes its status as the primary endpoint.
### Key Observations
1. **Variable Typing by Shape:** The diagram uses a consistent visual language: rectangles for confounders, a hexagon for the instrument, a diamond for the treatment, an oval for the mediator, and a circle for the outcome.
2. **Pathway Highlighting:** The causal path from Treatment (T) to Outcome (Y) via the Mediator (M) is emphasized with red arrows, drawing attention to the mediation analysis component of the model.
3. **Instrumental Variable Isolation:** The instrumental variable Z is visually and structurally isolated, connecting only to T. This is a critical feature for its valid use in causal inference.
4. **Complex Confounding:** The model accounts for confounding from two separate sources (X1 and X2), with X2 having a more complex role as it also affects the mediator.
### Interpretation
This diagram represents a sophisticated causal inference framework that combines **instrumental variable (IV) analysis** with **mediation analysis**.
* **Purpose:** The model is designed to estimate the causal effect of a Treatment (T) on an Outcome (Y) in the presence of unmeasured confounding, using Z as an instrument. Furthermore, it seeks to decompose this total effect into a direct effect and an indirect effect that flows through the Mediator (M).
* **Relationships:** The structure suggests that while Z can be used to isolate variation in T that is not confounded by X1 or X2, the effect of T on Y is not entirely direct. A portion of T's influence is transmitted through changing M, which in turn affects Y.
* **Notable Implications:**
* The direct arrow from X2 to M indicates that the mediator itself is confounded. This is an important consideration for mediation analysis, as it violates the "no mediator-outcome confounder" assumption unless X2 is measured and controlled.
* The absence of a direct arrow from Z to Y or M is the key assumption that makes Z a valid instrument. If this assumption is violated (e.g., Z affects Y through a path other than T), the IV estimates would be biased.
* This model would be used in fields like epidemiology, economics, or social sciences to answer questions such as: "What is the effect of a job training program (T) on future earnings (Y), and how much of that effect works through increasing skills (M), while accounting for pre-existing ability (X1, X2) using an instrument like random assignment to the program (Z)?"