## Histogram: Post-thinking Token Length Frequency
### Overview
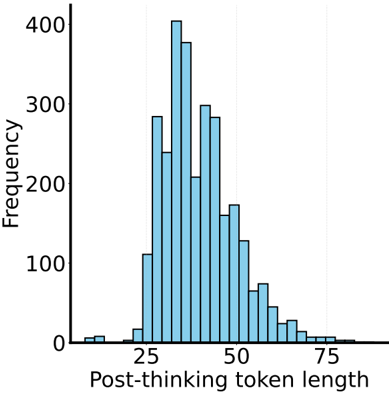
The image is a histogram showing the frequency distribution of "Post-thinking token length". The x-axis represents the token length, and the y-axis represents the frequency. The histogram bars are light blue.
### Components/Axes
* **X-axis:** "Post-thinking token length"
* Scale: 25, 50, 75
* **Y-axis:** "Frequency"
* Scale: 0, 100, 200, 300, 400
### Detailed Analysis
The histogram shows the distribution of token lengths. The frequency is highest around token lengths of 30-40, and it decreases as the token length increases or decreases from this range.
* **Token Length 10:** Frequency is approximately 5.
* **Token Length 20:** Frequency is approximately 10.
* **Token Length 30:** Frequency is approximately 400.
* **Token Length 40:** Frequency is approximately 300.
* **Token Length 50:** Frequency is approximately 280.
* **Token Length 60:** Frequency is approximately 70.
* **Token Length 70:** Frequency is approximately 20.
* **Token Length 80:** Frequency is approximately 5.
### Key Observations
* The distribution is unimodal, with a peak around token lengths of 30-40.
* The distribution is skewed to the right, indicating that there are more tokens with lengths less than the mean than tokens with lengths greater than the mean.
* The frequency drops off sharply after a token length of 50.
### Interpretation
The histogram suggests that the "Post-thinking" process tends to produce tokens with lengths between 30 and 40 most frequently. Shorter and longer tokens are less common. The right skew indicates that while longer tokens exist, they are relatively rare compared to the shorter ones. This could be due to the nature of the "Post-thinking" process, which might favor generating tokens of a certain length range.