\n
## Histogram: Post-thinking Token Length Distribution
### Overview
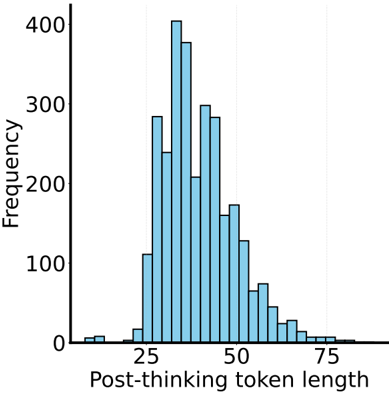
The image presents a histogram visualizing the distribution of "Post-thinking token length". The x-axis represents the token length, and the y-axis represents the frequency of occurrence for each token length. The distribution appears approximately normal, with a peak around a token length of 30-40.
### Components/Axes
* **X-axis Label:** "Post-thinking token length"
* **Y-axis Label:** "Frequency"
* **X-axis Scale:** Ranges from approximately 0 to 80, with markings at intervals of 10.
* **Y-axis Scale:** Ranges from 0 to 400, with markings at intervals of 100.
* **Histogram Bars:** Represent the frequency of each token length. The bars are light blue.
### Detailed Analysis
The histogram shows the following approximate frequencies for different token lengths:
* **Token Length 10-15:** Frequency ≈ 20
* **Token Length 15-20:** Frequency ≈ 290
* **Token Length 20-25:** Frequency ≈ 320
* **Token Length 25-30:** Frequency ≈ 400
* **Token Length 30-35:** Frequency ≈ 380
* **Token Length 35-40:** Frequency ≈ 310
* **Token Length 40-45:** Frequency ≈ 220
* **Token Length 45-50:** Frequency ≈ 160
* **Token Length 50-55:** Frequency ≈ 100
* **Token Length 55-60:** Frequency ≈ 60
* **Token Length 60-65:** Frequency ≈ 30
* **Token Length 65-70:** Frequency ≈ 10
* **Token Length 70-75:** Frequency ≈ 5
* **Token Length 75-80:** Frequency ≈ 2
The distribution is unimodal, peaking between 25 and 35. The data tapers off symmetrically on both sides of the peak.
### Key Observations
* The most frequent token length falls within the range of 25-35.
* The distribution is relatively symmetrical, suggesting a normal distribution.
* Token lengths below 20 and above 60 are relatively rare.
### Interpretation
This histogram likely represents the length of text generated after a "thinking" or processing step in a language model or similar system. The "post-thinking token length" could refer to the number of tokens produced after the model has performed some internal reasoning or planning.
The peak around 30-40 tokens suggests that the model typically generates responses of this length after the thinking step. The symmetrical distribution indicates that the model's output length is relatively consistent. The rarity of very short or very long token lengths suggests that the model tends to avoid overly concise or verbose responses.
The data suggests that the "thinking" process results in a relatively predictable and controlled output length. This could be due to constraints imposed on the model's output, or it could be a natural consequence of the model's internal mechanisms. Further investigation would be needed to understand the underlying reasons for this distribution.