## Diagram: Model Architectures - Search-Adaptor, Matryoshka-Adaptor, and SMEC
### Overview
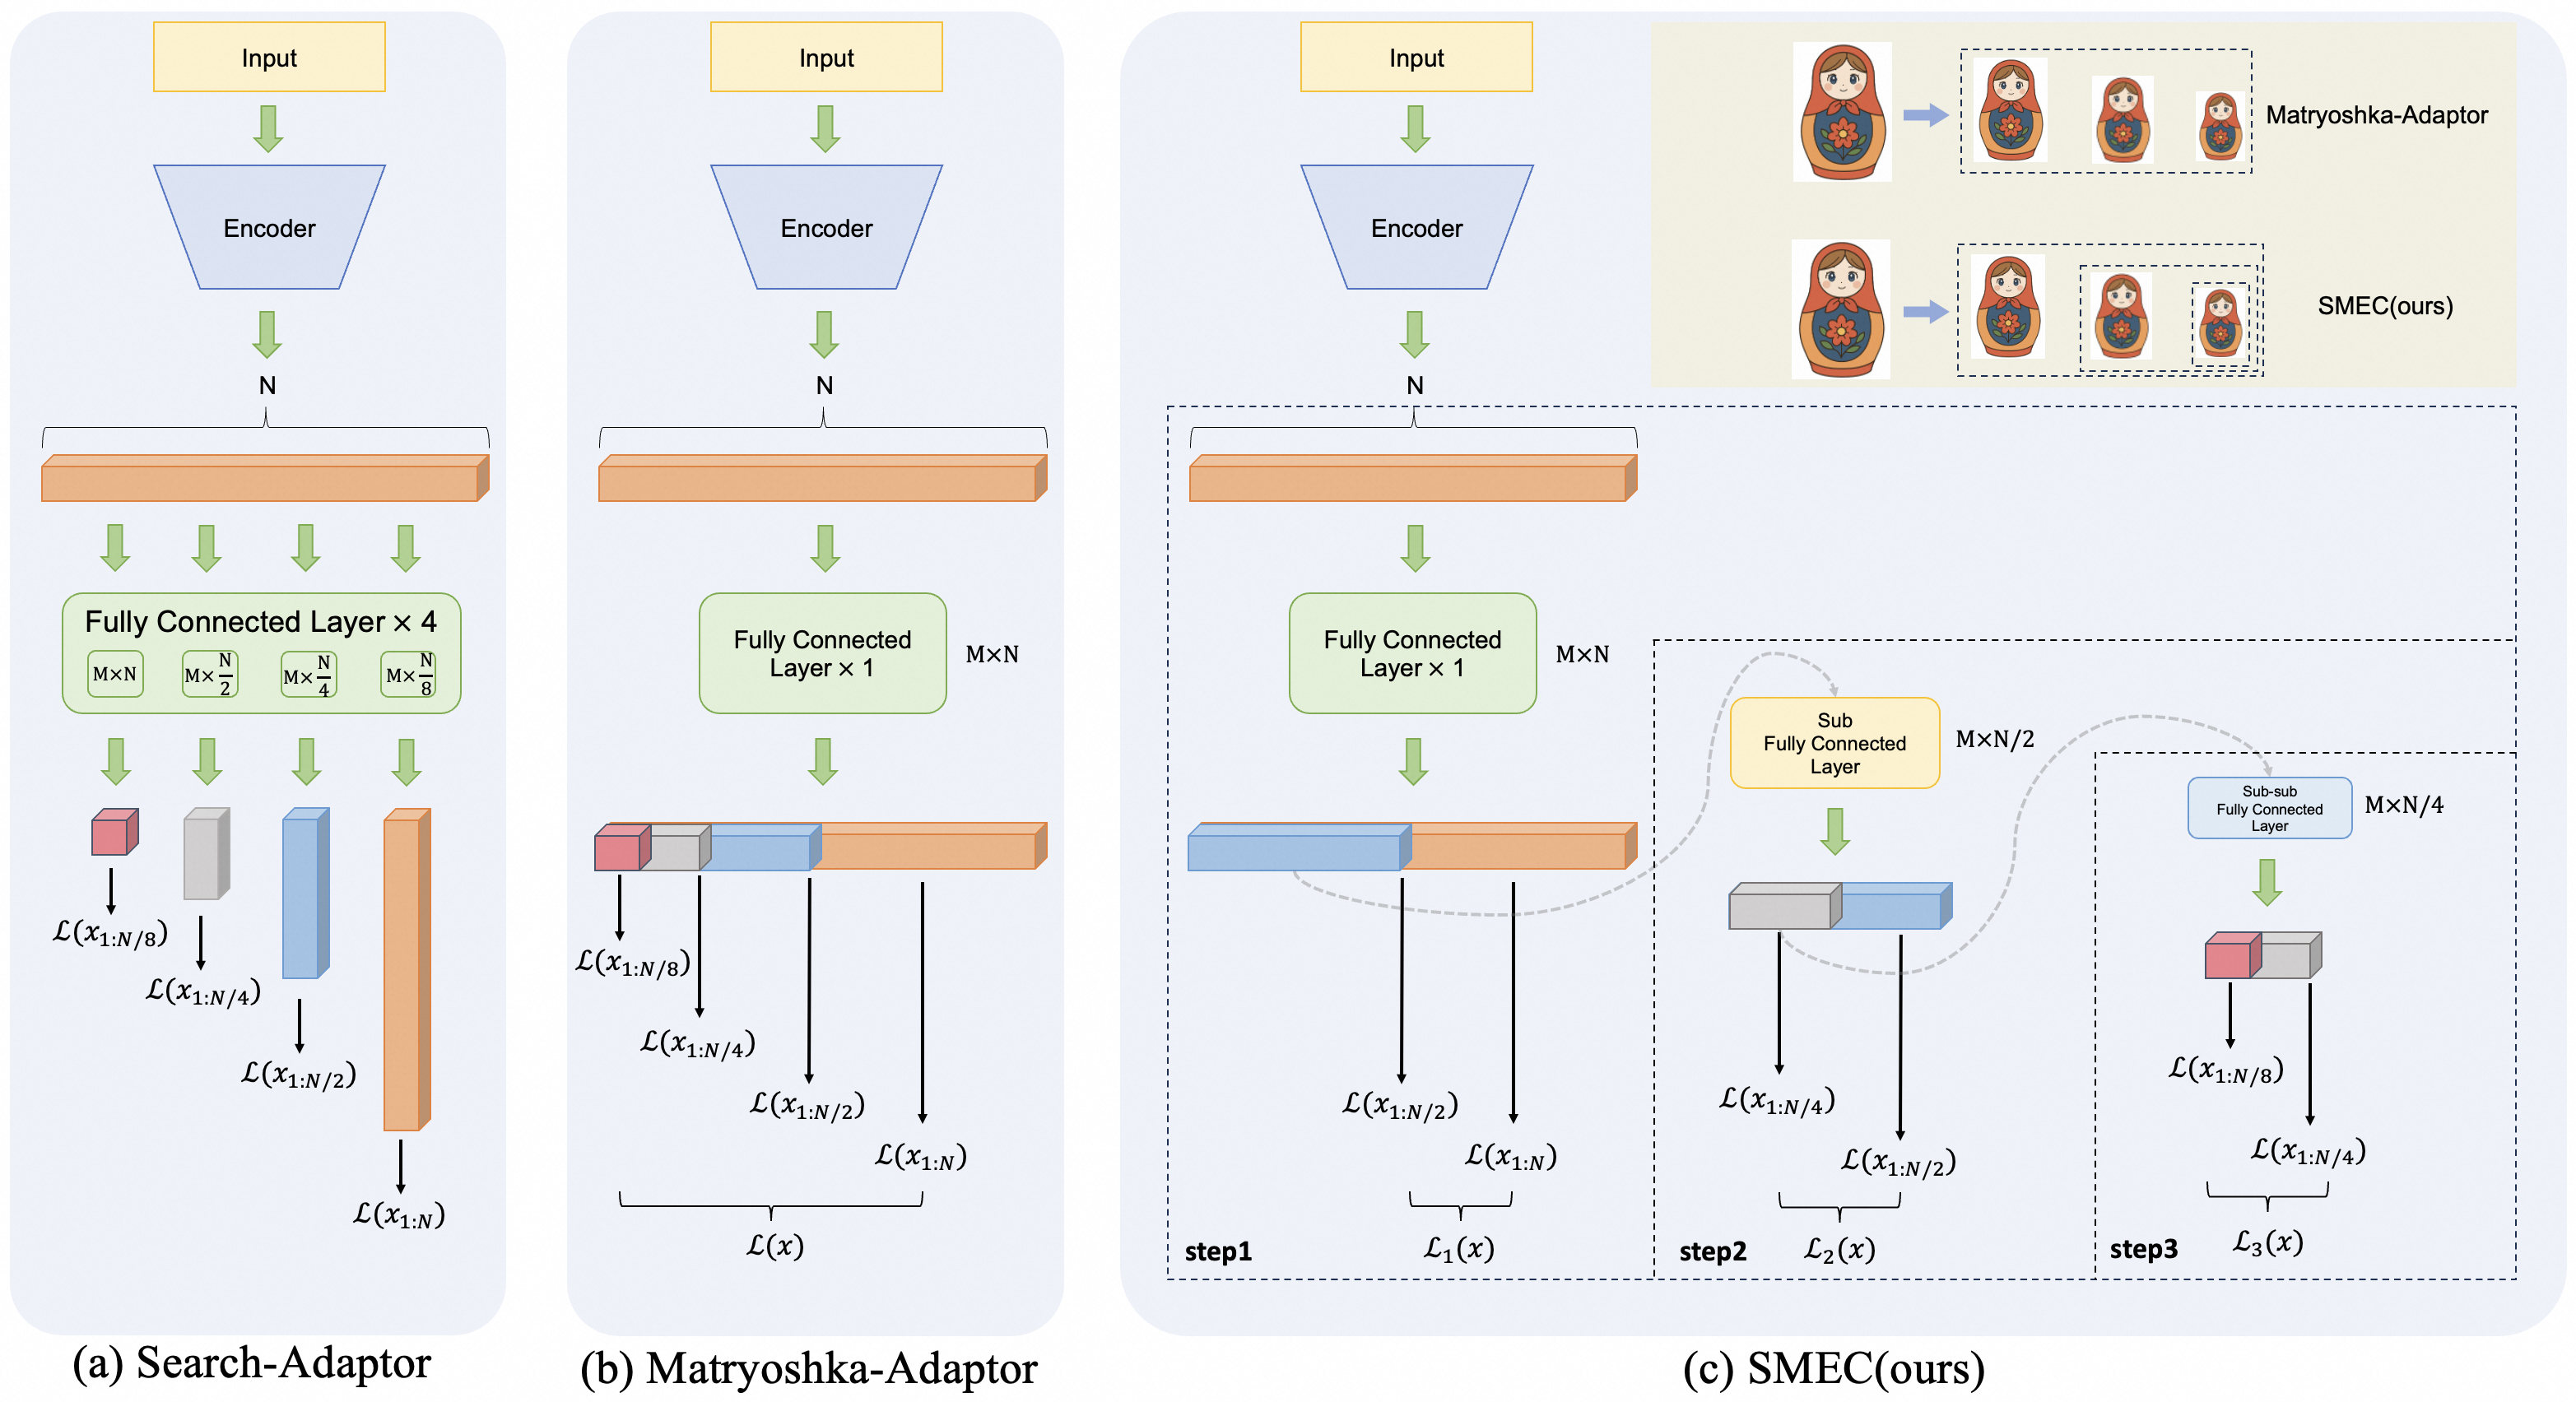
The image presents a comparative diagram illustrating the architectures of three different models: Search-Adaptor, Matryoshka-Adaptor, and SMEC (the authors' model). Each model is depicted as a series of processing blocks connected by arrows, representing the flow of data. The diagram highlights the key differences in their structures, particularly in the adaptation layers.
### Components/Axes
The diagram is divided into three main sections, labeled (a) Search-Adaptor, (b) Matryoshka-Adaptor, and (c) SMEC(ours). Each section shows the model's architecture. Common components include:
* **Input:** The starting point of the data flow.
* **Encoder:** A block that processes the input.
* **Fully Connected Layer:** Layers with varying dimensions (MxN, N, Mx4, Mx2, Mx/4) are used.
* **L(X1:N/β), L(X1:N/δ), L(X1:N/2):** Loss functions or layers.
* **Step 1, Step 2, Step 3:** Sequential steps in the SMEC model.
* **Matryoshka-Adaptor & SMEC(ours):** Include visual representations of nested dolls (Matryoshka) and a grid of smaller images, respectively.
### Detailed Analysis or Content Details
**(a) Search-Adaptor:**
* Input flows into an Encoder, resulting in output 'N'.
* 'N' is fed into four Fully Connected Layers, each with dimensions MxN, N, Mx4, and Mx2, respectively.
* These layers are connected to three loss functions: L(X1:N/β), L(X1:N/δ), and L(X1:N/2).
* The final output is L(X1:N).
**(b) Matryoshka-Adaptor:**
* Input flows into an Encoder, resulting in output 'N'.
* 'N' is fed into a single Fully Connected Layer with dimensions MxN.
* This layer is connected to three loss functions: L(X1:N/β), L(X1:N/δ), and L(X1:N/2).
* The final output is L(X).
**(c) SMEC(ours):**
* Input flows into an Encoder, resulting in output 'N'.
* 'N' is fed into a Fully Connected Layer with dimensions MxN.
* **Step 1:** The output is connected to loss function L1(x).
* **Step 2:** The output is fed into a "Sub-Fully Connected Layer" with dimensions MxN/2, connected to loss function L2(x).
* **Step 3:** The output of Step 2 is fed into another "Sub-Fully Connected Layer" with dimensions MxN/4, connected to loss function L3(x).
* The final output is L(X1:N/β), L(X1:N/δ), and L(X1:N/2).
* A visual representation of Matryoshka dolls is shown, with the largest doll representing the Matryoshka-Adaptor and the SMEC(ours) model represented by a grid of smaller images.
### Key Observations
* The SMEC model introduces a multi-step adaptation process with progressively smaller fully connected layers.
* The Matryoshka-Adaptor uses a single adaptation layer, while the Search-Adaptor uses multiple parallel adaptation layers.
* The SMEC model appears to build upon the Matryoshka-Adaptor concept by adding sequential adaptation steps.
* The visual representations of the Matryoshka dolls and the grid of images in the SMEC model suggest a hierarchical or nested structure.
### Interpretation
The diagram illustrates a progression in model architecture design for adaptation tasks. The Search-Adaptor explores multiple adaptation pathways simultaneously, while the Matryoshka-Adaptor adopts a single, more focused adaptation layer. The SMEC model, presented as the authors' contribution, refines this approach by introducing a sequential, hierarchical adaptation process. The use of smaller fully connected layers in each step of SMEC suggests a gradual refinement of the adaptation process, potentially leading to more precise and efficient adaptation. The visual metaphors of the Matryoshka dolls and the grid of images reinforce the idea of nested structures and hierarchical relationships within the models. The loss functions (L(X1:N/β), L(X1:N/δ), L(X1:N/2)) likely represent different aspects of the adaptation process, and their presence in each model indicates a common focus on minimizing adaptation error. The diagram doesn't provide specific data or numerical values, but it effectively communicates the structural differences between the three models and their potential implications for adaptation performance. The diagram is a conceptual illustration of model architectures, not a presentation of experimental results.