## Bar Chart: Performance Comparison of ToT vs. Ours
### Overview
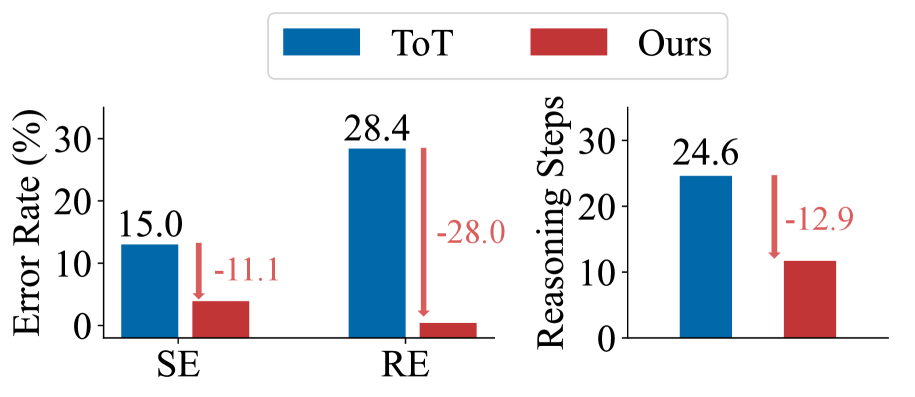
The image presents a bar chart comparing the performance of two methods, "ToT" and "Ours," across two metrics: "Error Rate (%)" and "Reasoning Steps." The chart is divided into two sections, one for each metric. Each section displays the values for both methods as vertical bars, with numerical values displayed above each bar. Arrows indicate the difference between the "ToT" and "Ours" values.
### Components/Axes
* **Legend:** Located at the top of the chart.
* Blue bar: "ToT"
* Red bar: "Ours"
* **Left Chart:**
* Y-axis: "Error Rate (%)", with scale markings at 0, 10, 20, and 30.
* X-axis: Categorical, with two categories: "SE" and "RE".
* **Right Chart:**
* Y-axis: "Reasoning Steps", with scale markings at 0, 10, 20, and 30.
* X-axis: Implicitly categorical, with one category.
### Detailed Analysis
**Left Chart: Error Rate (%)**
* **SE (leftmost data):**
* ToT (blue bar): Error Rate of 15.0%
* Ours (red bar): The difference between ToT and Ours is -11.1%. Therefore, the Error Rate for Ours is approximately 15.0 - 11.1 = 3.9%
* **RE (rightmost data):**
* ToT (blue bar): Error Rate of 28.4%
* Ours (red bar): The difference between ToT and Ours is -28.0%. Therefore, the Error Rate for Ours is approximately 28.4 - 28.0 = 0.4%
**Right Chart: Reasoning Steps**
* ToT (blue bar): Reasoning Steps of 24.6
* Ours (red bar): The difference between ToT and Ours is -12.9. Therefore, the Reasoning Steps for Ours is approximately 24.6 - 12.9 = 11.7
### Key Observations
* In both metrics ("Error Rate" for SE and RE, and "Reasoning Steps"), "Ours" consistently outperforms "ToT," as indicated by the negative differences (downward arrows).
* The reduction in "Error Rate" is more significant for "RE" (-28.0%) compared to "SE" (-11.1%).
* The reduction in "Reasoning Steps" is -12.9.
### Interpretation
The data suggests that the "Ours" method is more effective than the "ToT" method, resulting in lower error rates and fewer reasoning steps. The substantial reduction in error rate for "RE" indicates that "Ours" is particularly advantageous in this category. The reduction in reasoning steps suggests that "Ours" is also more efficient. Overall, the chart provides evidence that "Ours" is a superior approach compared to "ToT" in the contexts evaluated.