\n
## Bar Chart: Error Rate and Reasoning Steps Comparison
### Overview
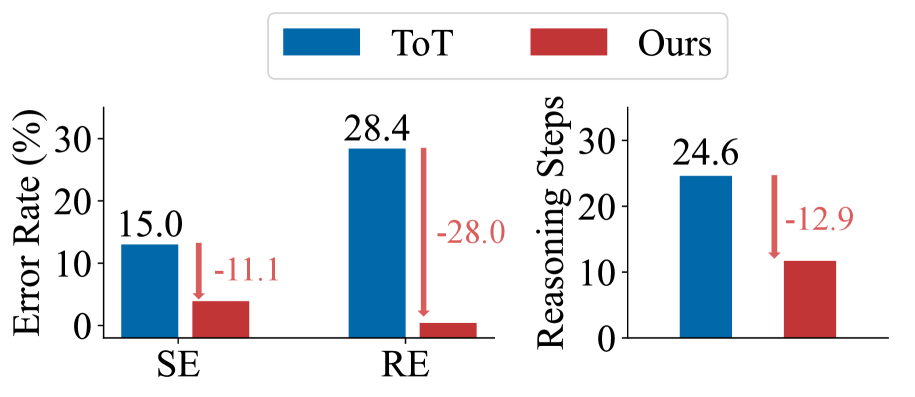
This image presents a comparative bar chart illustrating the performance of two methods, "ToT" (Tree of Thoughts) and "Ours," across two evaluation metrics: Error Rate (%) and Reasoning Steps. The chart consists of two sub-charts, side-by-side, each comparing the two methods on one metric. The chart uses a color scheme of blue for "ToT" and red for "Ours". Red arrows indicate the percentage difference between the two methods.
### Components/Axes
* **X-axis (Both Charts):** Categories representing the evaluation tasks: "SE" (likely representing a task type) and "RE" (likely representing another task type).
* **Y-axis (Left Chart):** Error Rate (%), ranging from 0 to 30.
* **Y-axis (Right Chart):** Reasoning Steps, ranging from 0 to 30.
* **Legend (Top-Left):**
* Blue: "ToT"
* Red: "Ours"
* **Arrows:** Red arrows with percentage values indicating the difference in performance between "ToT" and "Ours".
### Detailed Analysis or Content Details
**Left Chart: Error Rate (%)**
* **SE:**
* ToT (Blue): Approximately 15.0%. The bar reaches the 15% mark on the y-axis.
* Ours (Red): Approximately -11.1%. The bar reaches the -11.1% mark on the y-axis.
* Difference (Arrow): -28.0% (indicating "Ours" has a 28% lower error rate than "ToT").
* **RE:**
* ToT (Blue): Approximately 28.4%. The bar reaches the 28.4% mark on the y-axis.
* Ours (Red): Approximately 0%. The bar is very short, close to the x-axis.
* Difference (Arrow): -28.0% (indicating "Ours" has a 28% lower error rate than "ToT").
**Right Chart: Reasoning Steps**
* **SE:**
* ToT (Blue): Approximately 24.6. The bar reaches the 24.6 mark on the y-axis.
* Ours (Red): Approximately 11.7. The bar reaches the 11.7 mark on the y-axis.
* Difference (Arrow): -12.9 (indicating "Ours" requires 12.9 fewer reasoning steps than "ToT").
* **RE:**
* ToT (Blue): Approximately 24.6. The bar reaches the 24.6 mark on the y-axis.
* Ours (Red): Approximately 11.7. The bar reaches the 11.7 mark on the y-axis.
* Difference (Arrow): -12.9 (indicating "Ours" requires 12.9 fewer reasoning steps than "ToT").
### Key Observations
* "Ours" consistently outperforms "ToT" in both Error Rate and Reasoning Steps across both tasks (SE and RE).
* The reduction in Error Rate is substantial, particularly for the "RE" task, where "Ours" achieves an error rate close to zero.
* The reduction in Reasoning Steps is consistent across both tasks, approximately 12.9 steps.
* The error rate for "ToT" is significantly higher for the "RE" task compared to the "SE" task.
### Interpretation
The data suggests that the "Ours" method is significantly more efficient and accurate than the "ToT" method for both "SE" and "RE" tasks. The substantial reduction in error rate, especially for the "RE" task, indicates that "Ours" is better at avoiding mistakes. The lower number of reasoning steps suggests that "Ours" is more streamlined and requires less computational effort. The consistent performance improvement across both tasks implies that the benefits of "Ours" are not task-specific. The large difference in error rate between the two tasks for "ToT" suggests that "ToT" may struggle with the complexities of the "RE" task. The arrows clearly highlight the magnitude of the improvement offered by "Ours" in both metrics.