## Bar Chart Comparison: Error Rate and Reasoning Steps
### Overview
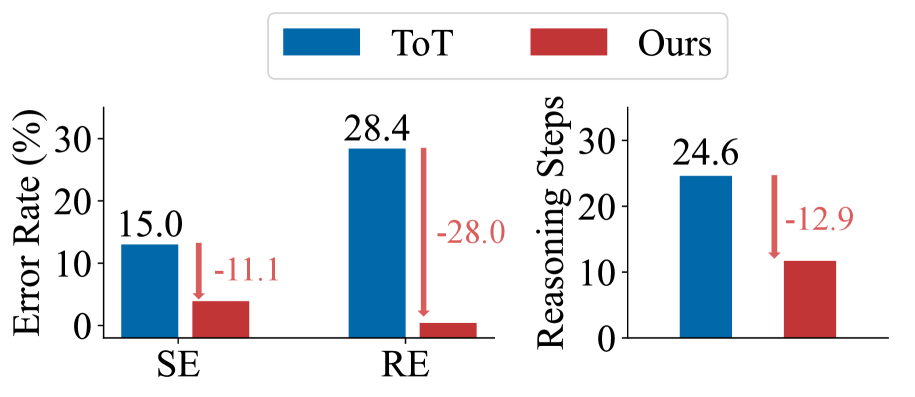
The image displays a two-panel bar chart comparing the performance of two methods, labeled "ToT" (blue bars) and "Ours" (red bars). The left panel compares "Error Rate (%)" across two categories, "SE" and "RE." The right panel compares the number of "Reasoning Steps" for a single, unspecified category. The chart visually emphasizes the reduction in both error rate and reasoning steps achieved by the "Ours" method relative to "ToT."
### Components/Axes
* **Legend:** Positioned at the top center. Contains two entries:
* A blue rectangle labeled "ToT".
* A red rectangle labeled "Ours".
* **Left Chart (Error Rate):**
* **Y-axis:** Labeled "Error Rate (%)". Scale markers at 0, 10, 20, and 30.
* **X-axis:** Two categorical labels: "SE" and "RE".
* **Right Chart (Reasoning Steps):**
* **Y-axis:** Labeled "Reasoning Steps". Scale markers at 0, 10, 20, and 30.
* **X-axis:** No explicit label. Contains a single pair of bars.
* **Data Annotations:** Red downward-pointing arrows with numerical labels indicate the absolute reduction from the "ToT" value to the "Ours" value.
### Detailed Analysis
**Left Panel: Error Rate (%)**
* **Category SE:**
* **ToT (Blue Bar):** Value is explicitly labeled as **15.0**.
* **Ours (Red Bar):** The bar is significantly shorter. A red arrow points from the top of the ToT bar down to the top of the Ours bar, labeled **-11.1**. This indicates the "Ours" error rate is approximately 15.0 - 11.1 = **3.9%**.
* **Category RE:**
* **ToT (Blue Bar):** Value is explicitly labeled as **28.4**.
* **Ours (Red Bar):** The bar is very short, near the baseline. A red arrow points from the top of the ToT bar down to the top of the Ours bar, labeled **-28.0**. This indicates the "Ours" error rate is approximately 28.4 - 28.0 = **0.4%**.
**Right Panel: Reasoning Steps**
* **ToT (Blue Bar):** Value is explicitly labeled as **24.6**.
* **Ours (Red Bar):** The bar is shorter. A red arrow points from the top of the ToT bar down to the top of the Ours bar, labeled **-12.9**. This indicates the "Ours" method uses approximately 24.6 - 12.9 = **11.7** reasoning steps.
### Key Observations
1. **Consistent Superiority:** The "Ours" method outperforms "ToT" on all presented metrics, showing both lower error rates and fewer reasoning steps.
2. **Magnitude of Improvement:** The reduction is most dramatic in the "RE" error rate, where the error drops by 28.0 percentage points (a ~98.6% relative reduction). The reduction in reasoning steps is also substantial, cutting the count by more than half.
3. **Visual Design:** The use of red downward arrows directly on the chart provides an immediate, quantitative understanding of the improvement without requiring the viewer to calculate differences from the axis.
### Interpretation
This chart is designed to convincingly demonstrate the effectiveness of a proposed method ("Ours") against a baseline or alternative method ("ToT"). The data suggests that "Ours" is not only more accurate (lower error rates) but also more efficient (requires fewer reasoning steps). The near-elimination of error in the "RE" category is a particularly strong result.
The pairing of error rate and reasoning steps implies a relationship between efficiency and accuracy. The chart argues that the "Ours" method achieves better outcomes *while* using a simpler or more direct reasoning process, which is a highly desirable property in computational or AI systems. The clear, annotated presentation is typical of a research paper or technical report aiming to highlight a significant methodological advancement.