## Bar Chart: Comparative Performance of ToT and Ours Methods
### Overview
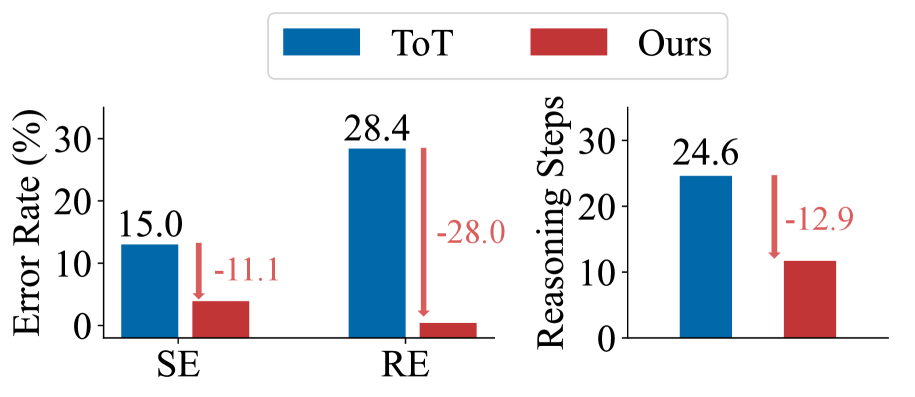
The image presents two side-by-side bar charts comparing the performance of two methods ("ToT" and "Ours") across three metrics: **Error Rate (%)** and **Reasoning Steps**. The charts use color-coded bars (blue for ToT, red for Ours) and include percentage-based annotations with directional arrows indicating performance differences.
---
### Components/Axes
1. **Legend**:
- Positioned at the top center.
- Labels:
- Blue = ToT
- Red = Ours
2. **Left Chart (Error Rate %)**:
- **X-axis**: Categories labeled "SE" (left) and "RE" (right).
- **Y-axis**: Error Rate (%) with a scale from 0 to 30.
- **Bars**:
- SE: ToT (15.0%), Ours (4.9%).
- RE: ToT (28.4%), Ours (0.4%).
3. **Right Chart (Reasoning Steps)**:
- **X-axis**: Same categories ("SE" and "RE").
- **Y-axis**: Reasoning Steps with a scale from 0 to 30.
- **Bars**:
- SE: ToT (24.6 steps), Ours (11.7 steps).
- RE: No data shown (only SE is labeled).
---
### Detailed Analysis
1. **Error Rate (%)**:
- **SE**:
- ToT: 15.0% (blue bar).
- Ours: 4.9% (red bar), a **11.1% reduction** (arrow labeled "-11.1").
- **RE**:
- ToT: 28.4% (blue bar).
- Ours: 0.4% (red bar), a **28.0% reduction** (arrow labeled "-28.0").
2. **Reasoning Steps**:
- **SE**:
- ToT: 24.6 steps (blue bar).
- Ours: 11.7 steps (red bar), a **12.9% reduction** (arrow labeled "-12.9").
- **RE**: No data provided for Reasoning Steps.
---
### Key Observations
1. **Error Rate Reduction**:
- Ours outperforms ToT in both SE and RE, with the largest improvement in RE (-28.0%).
- RE Error Rate for Ours is nearly negligible (0.4%), suggesting near-perfect performance in this category.
2. **Reasoning Steps**:
- Ours reduces reasoning steps by 12.9% in SE, indicating efficiency gains.
- No data for RE Reasoning Steps limits conclusions about its impact there.
3. **Visual Trends**:
- Red bars (Ours) are consistently shorter than blue bars (ToT) across all metrics.
- Arrows emphasize the magnitude of improvement, with RE showing the most dramatic reduction.
---
### Interpretation
The data demonstrates that the "Ours" method significantly outperforms "ToT" in reducing both error rates and reasoning steps. The most notable improvement occurs in the **RE** category, where error rates drop from 28.4% to 0.4%—a 28.0% reduction. This suggests the method is particularly effective in complex or high-stakes scenarios (RE). The reduction in reasoning steps (12.9%) further implies computational efficiency gains. However, the absence of RE Reasoning Steps data leaves a gap in understanding its full impact. The consistent performance across metrics indicates a robust, generalizable improvement in the "Ours" approach.