## Histogram: Math-Shepherd
### Overview
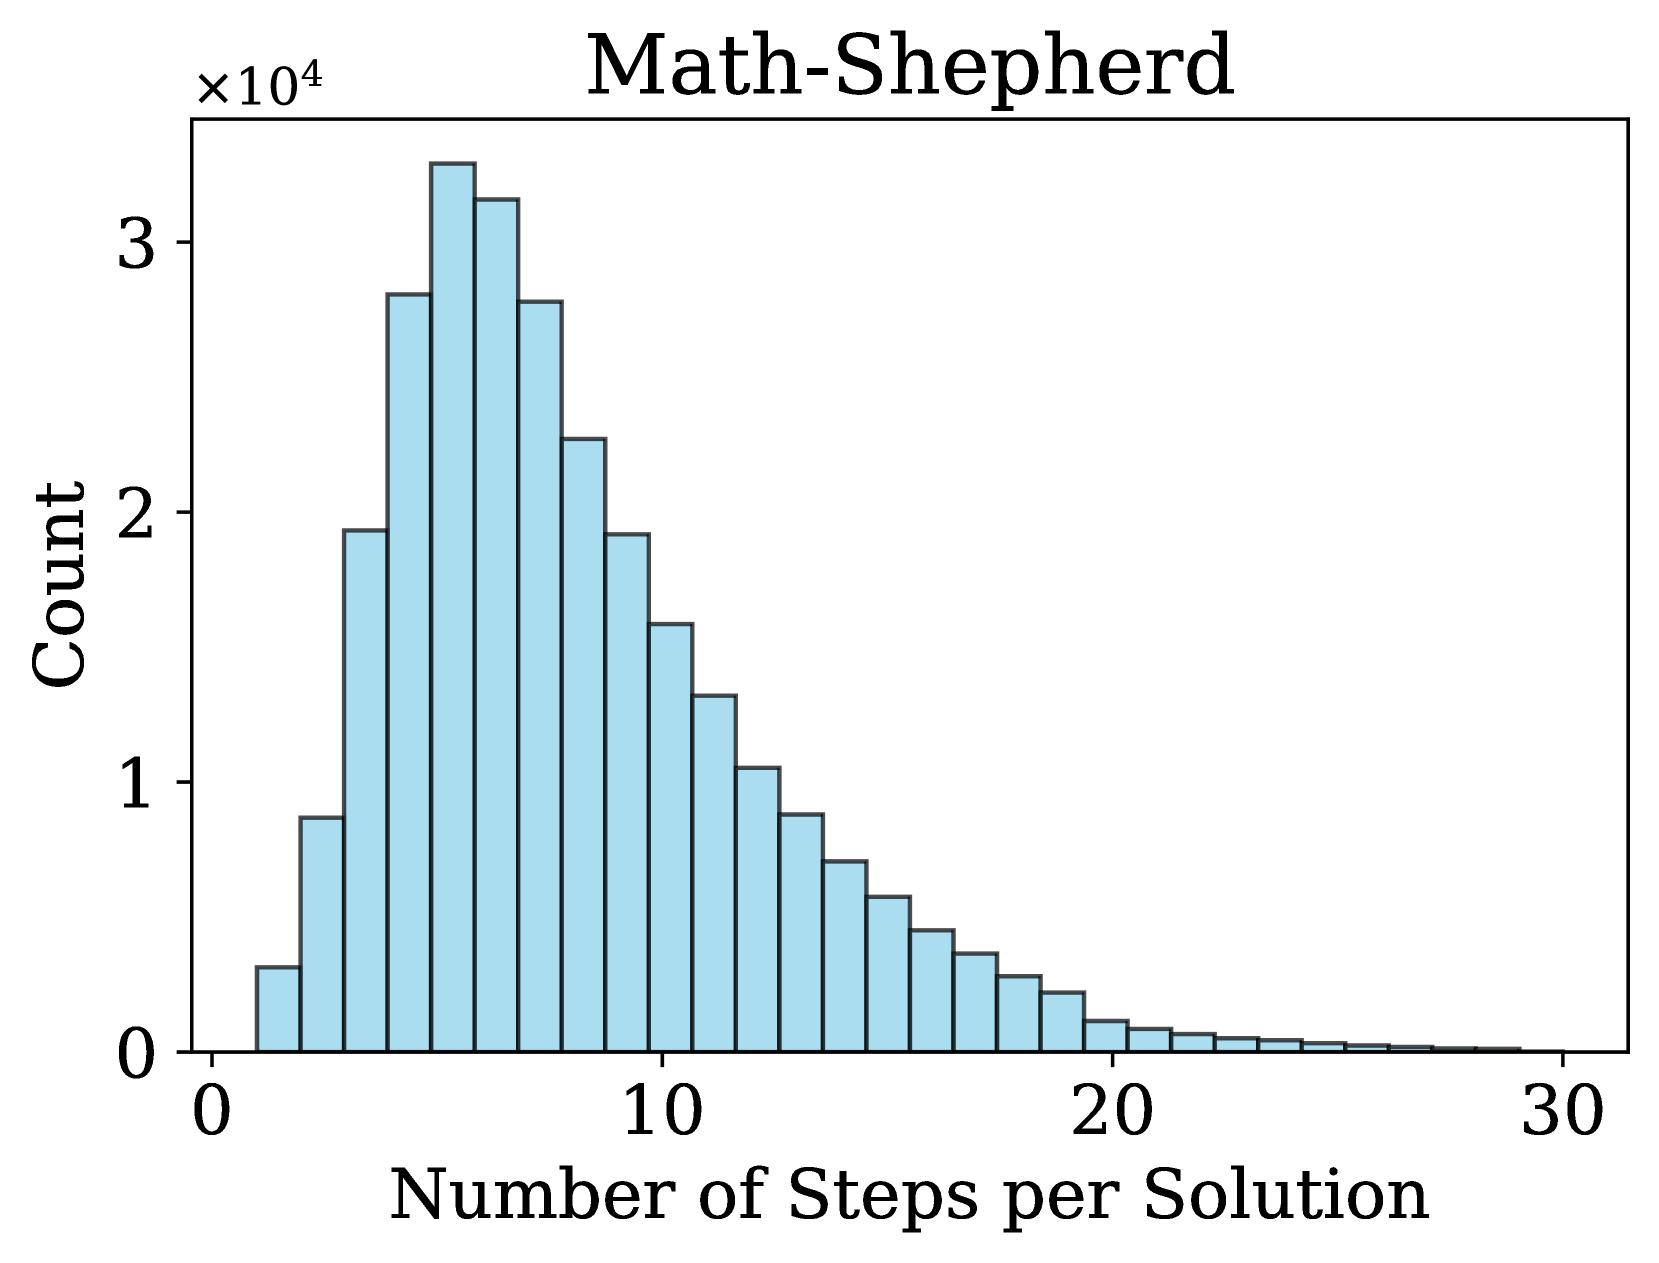
The image is a histogram titled "Math-Shepherd". It displays the distribution of the number of steps per solution. The x-axis represents the "Number of Steps per Solution", ranging from 0 to 30. The y-axis represents the "Count", scaled by a factor of 10^4, ranging from 0 to 3. The histogram consists of light blue bars with dark outlines, showing the frequency of solutions for each step count.
### Components/Axes
* **Title:** Math-Shepherd
* **X-axis:**
* Label: Number of Steps per Solution
* Scale: 0 to 30, with tick marks at intervals of 10 (0, 10, 20, 30)
* **Y-axis:**
* Label: Count
* Scale: 0 to 3, multiplied by 10^4 (indicated by "x10^4" at the top of the y-axis), with tick marks at intervals of 1 (0, 1, 2, 3)
* **Bars:** Light blue with dark outlines, representing the frequency of each step count.
### Detailed Analysis
The histogram shows a distribution where the count is highest for a relatively small number of steps and decreases as the number of steps increases.
* **Step 0:** Count is approximately 0.3 x 10^4 = 3000
* **Step 1:** Count is approximately 0.9 x 10^4 = 9000
* **Step 2:** Count is approximately 1.9 x 10^4 = 19000
* **Step 3:** Count is approximately 2.8 x 10^4 = 28000
* **Step 4:** Count is approximately 3.2 x 10^4 = 32000
* **Step 5:** Count is approximately 3.3 x 10^4 = 33000
* **Step 6:** Count is approximately 3.1 x 10^4 = 31000
* **Step 7:** Count is approximately 2.8 x 10^4 = 28000
* **Step 8:** Count is approximately 2.4 x 10^4 = 24000
* **Step 9:** Count is approximately 2.2 x 10^4 = 22000
* **Step 10:** Count is approximately 1.9 x 10^4 = 19000
* **Step 11:** Count is approximately 1.7 x 10^4 = 17000
* **Step 12:** Count is approximately 1.5 x 10^4 = 15000
* **Step 13:** Count is approximately 1.3 x 10^4 = 13000
* **Step 14:** Count is approximately 1.1 x 10^4 = 11000
* **Step 15:** Count is approximately 0.9 x 10^4 = 9000
* **Step 16:** Count is approximately 0.7 x 10^4 = 7000
* **Step 17:** Count is approximately 0.6 x 10^4 = 6000
* **Step 18:** Count is approximately 0.5 x 10^4 = 5000
* **Step 19:** Count is approximately 0.4 x 10^4 = 4000
* **Step 20:** Count is approximately 0.3 x 10^4 = 3000
* **Step 21:** Count is approximately 0.2 x 10^4 = 2000
* **Step 22:** Count is approximately 0.15 x 10^4 = 1500
* **Step 23:** Count is approximately 0.1 x 10^4 = 1000
* **Step 24:** Count is approximately 0.08 x 10^4 = 800
* **Step 25:** Count is approximately 0.06 x 10^4 = 600
* **Step 26:** Count is approximately 0.04 x 10^4 = 400
* **Step 27:** Count is approximately 0.03 x 10^4 = 300
* **Step 28:** Count is approximately 0.02 x 10^4 = 200
* **Step 29:** Count is approximately 0.01 x 10^4 = 100
* **Step 30:** Count is approximately 0.005 x 10^4 = 50
### Key Observations
* The distribution is right-skewed (positive skew).
* The peak of the distribution occurs around 5 steps per solution.
* The count decreases significantly as the number of steps increases beyond 5.
* There are very few solutions that require more than 20 steps.
### Interpretation
The histogram suggests that the "Math-Shepherd" algorithm or process typically finds solutions in a relatively small number of steps. The right-skewed distribution indicates that while most solutions are found quickly, there are some cases that require a significantly larger number of steps. This could be due to the complexity of certain problems or the algorithm's search strategy. The data implies that the algorithm is generally efficient, but its performance can vary depending on the specific problem it is solving.