\n
## Histogram: Math-Shepherd - Number of Steps per Solution
### Overview
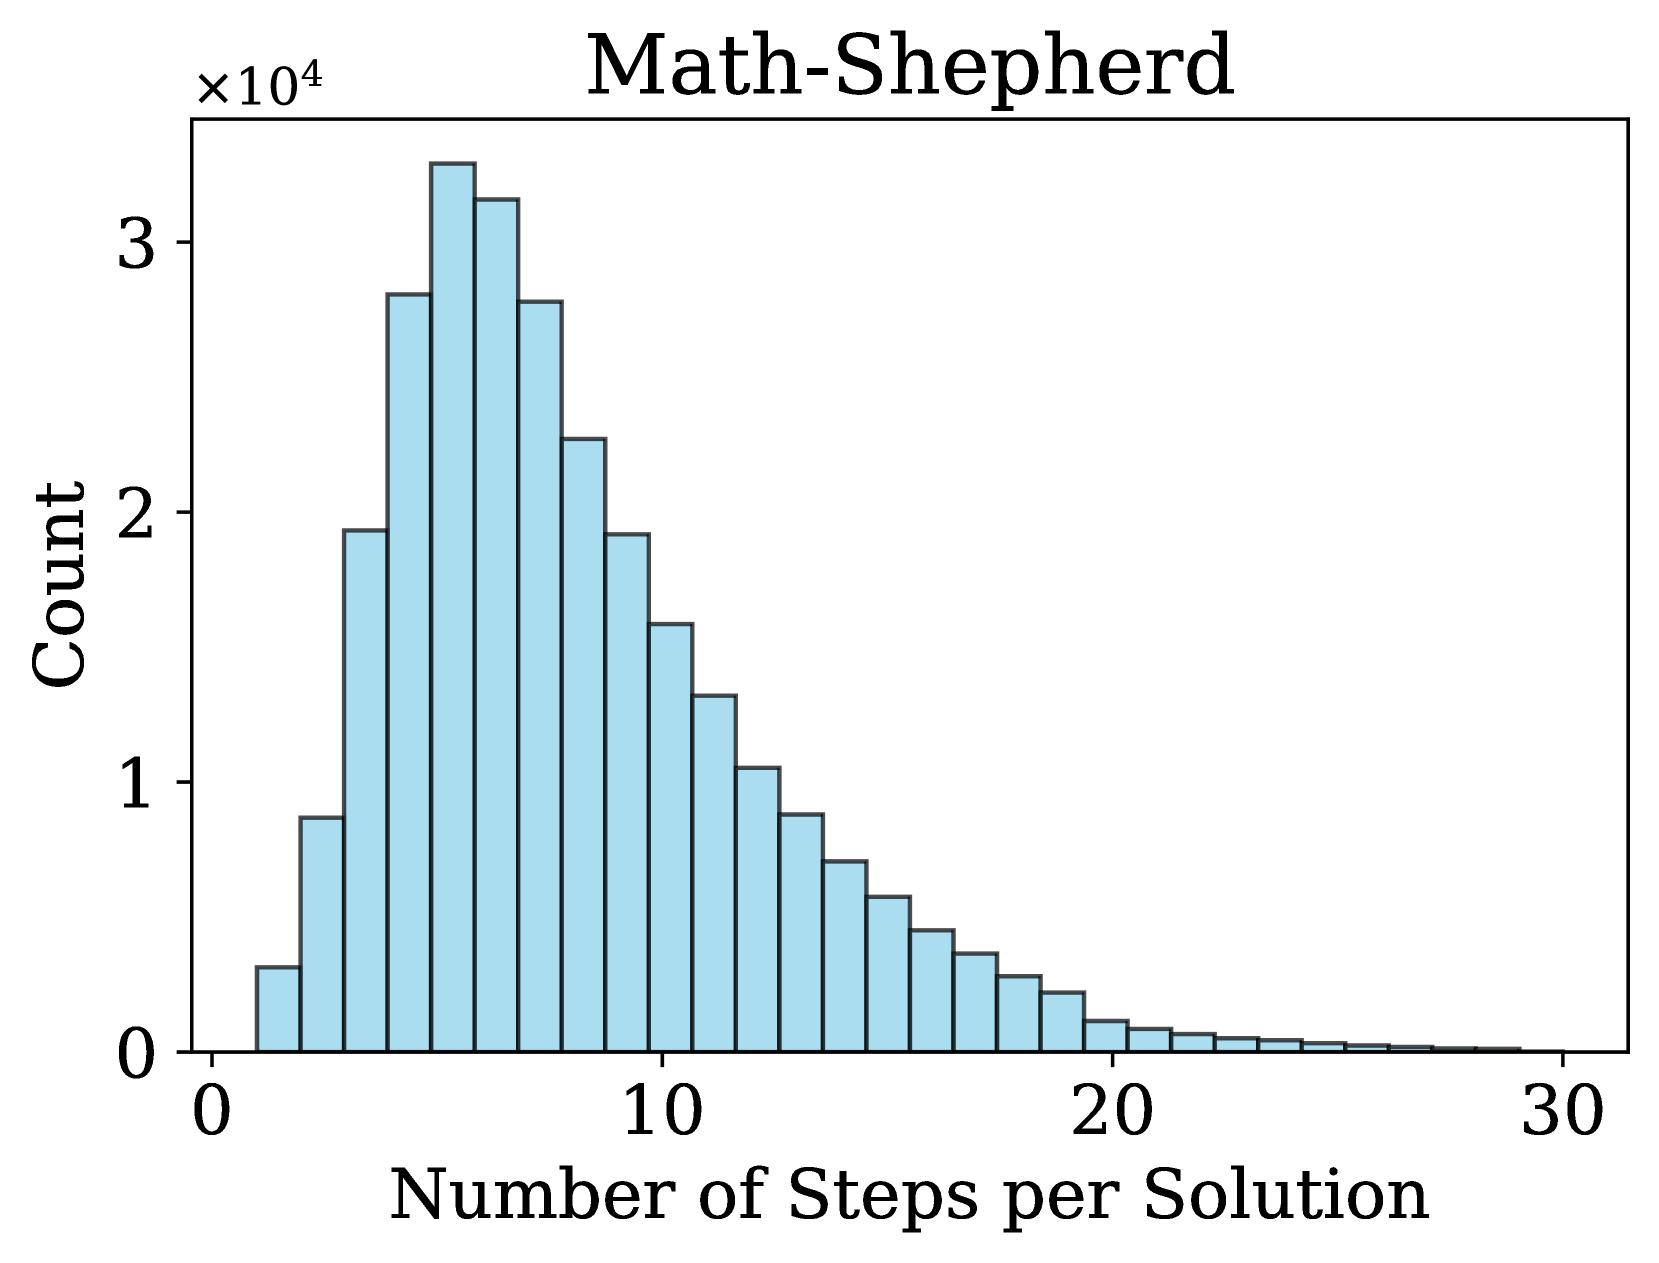
This image presents a histogram visualizing the distribution of the number of steps required to reach a solution, likely within the "Math-Shepherd" system. The x-axis represents the number of steps, and the y-axis represents the count of solutions requiring that number of steps. The distribution appears approximately normal, with a peak around 8-10 steps.
### Components/Axes
* **Title:** "Math-Shepherd" (centered at the top)
* **X-axis Label:** "Number of Steps per Solution" (ranging from 0 to 30)
* **Y-axis Label:** "Count" (scaled by x10<sup>4</sup>, ranging from 0 to 3.5 x 10<sup>4</sup>)
* **Bins:** The histogram consists of 30 bins, each representing a range of step counts.
* **Color:** The bars are filled with a light blue color.
### Detailed Analysis
The histogram shows a roughly symmetrical distribution. The peak of the distribution is approximately at 8-10 steps, with a count of around 3.2 x 10<sup>4</sup>.
Here's a breakdown of approximate counts for different step ranges:
* 0-2 steps: Approximately 0.2 x 10<sup>4</sup>
* 2-4 steps: Approximately 0.6 x 10<sup>4</sup>
* 4-6 steps: Approximately 1.5 x 10<sup>4</sup>
* 6-8 steps: Approximately 2.5 x 10<sup>4</sup>
* 8-10 steps: Approximately 3.2 x 10<sup>4</sup>
* 10-12 steps: Approximately 2.8 x 10<sup>4</sup>
* 12-14 steps: Approximately 2.0 x 10<sup>4</sup>
* 14-16 steps: Approximately 1.2 x 10<sup>4</sup>
* 16-18 steps: Approximately 0.6 x 10<sup>4</sup>
* 18-20 steps: Approximately 0.3 x 10<sup>4</sup>
* 20-22 steps: Approximately 0.1 x 10<sup>4</sup>
* 22-24 steps: Approximately 0.05 x 10<sup>4</sup>
* 24-26 steps: Approximately 0.02 x 10<sup>4</sup>
* 26-28 steps: Approximately 0.01 x 10<sup>4</sup>
* 28-30 steps: Approximately 0.005 x 10<sup>4</sup>
The distribution decreases rapidly as the number of steps increases beyond 12.
### Key Observations
* The most frequent number of steps required for a solution is between 8 and 10.
* The distribution is approximately bell-shaped, suggesting a normal distribution.
* There is a long tail extending to the right, indicating that some solutions require a significantly larger number of steps than the majority.
* Very few solutions require fewer than 4 steps.
### Interpretation
The data suggests that the "Math-Shepherd" system generally finds solutions with a moderate number of steps (around 8-10). The normal distribution indicates that the step count is relatively consistent for most problems. The presence of a tail suggests that some problems are considerably more complex and require a larger number of steps to solve. This could be due to the inherent difficulty of certain mathematical problems or limitations in the system's problem-solving approach. The relatively low count for solutions requiring fewer than 4 steps might indicate that the system doesn't often find very direct or simple solutions, or that such problems are less common within the dataset. The data could be used to evaluate the efficiency of the "Math-Shepherd" system and identify areas for improvement. For example, if the goal is to reduce the average number of steps required for a solution, efforts could be focused on optimizing the system's approach to more complex problems.