## Histogram: Math-Shepherd Step Distribution
### Overview
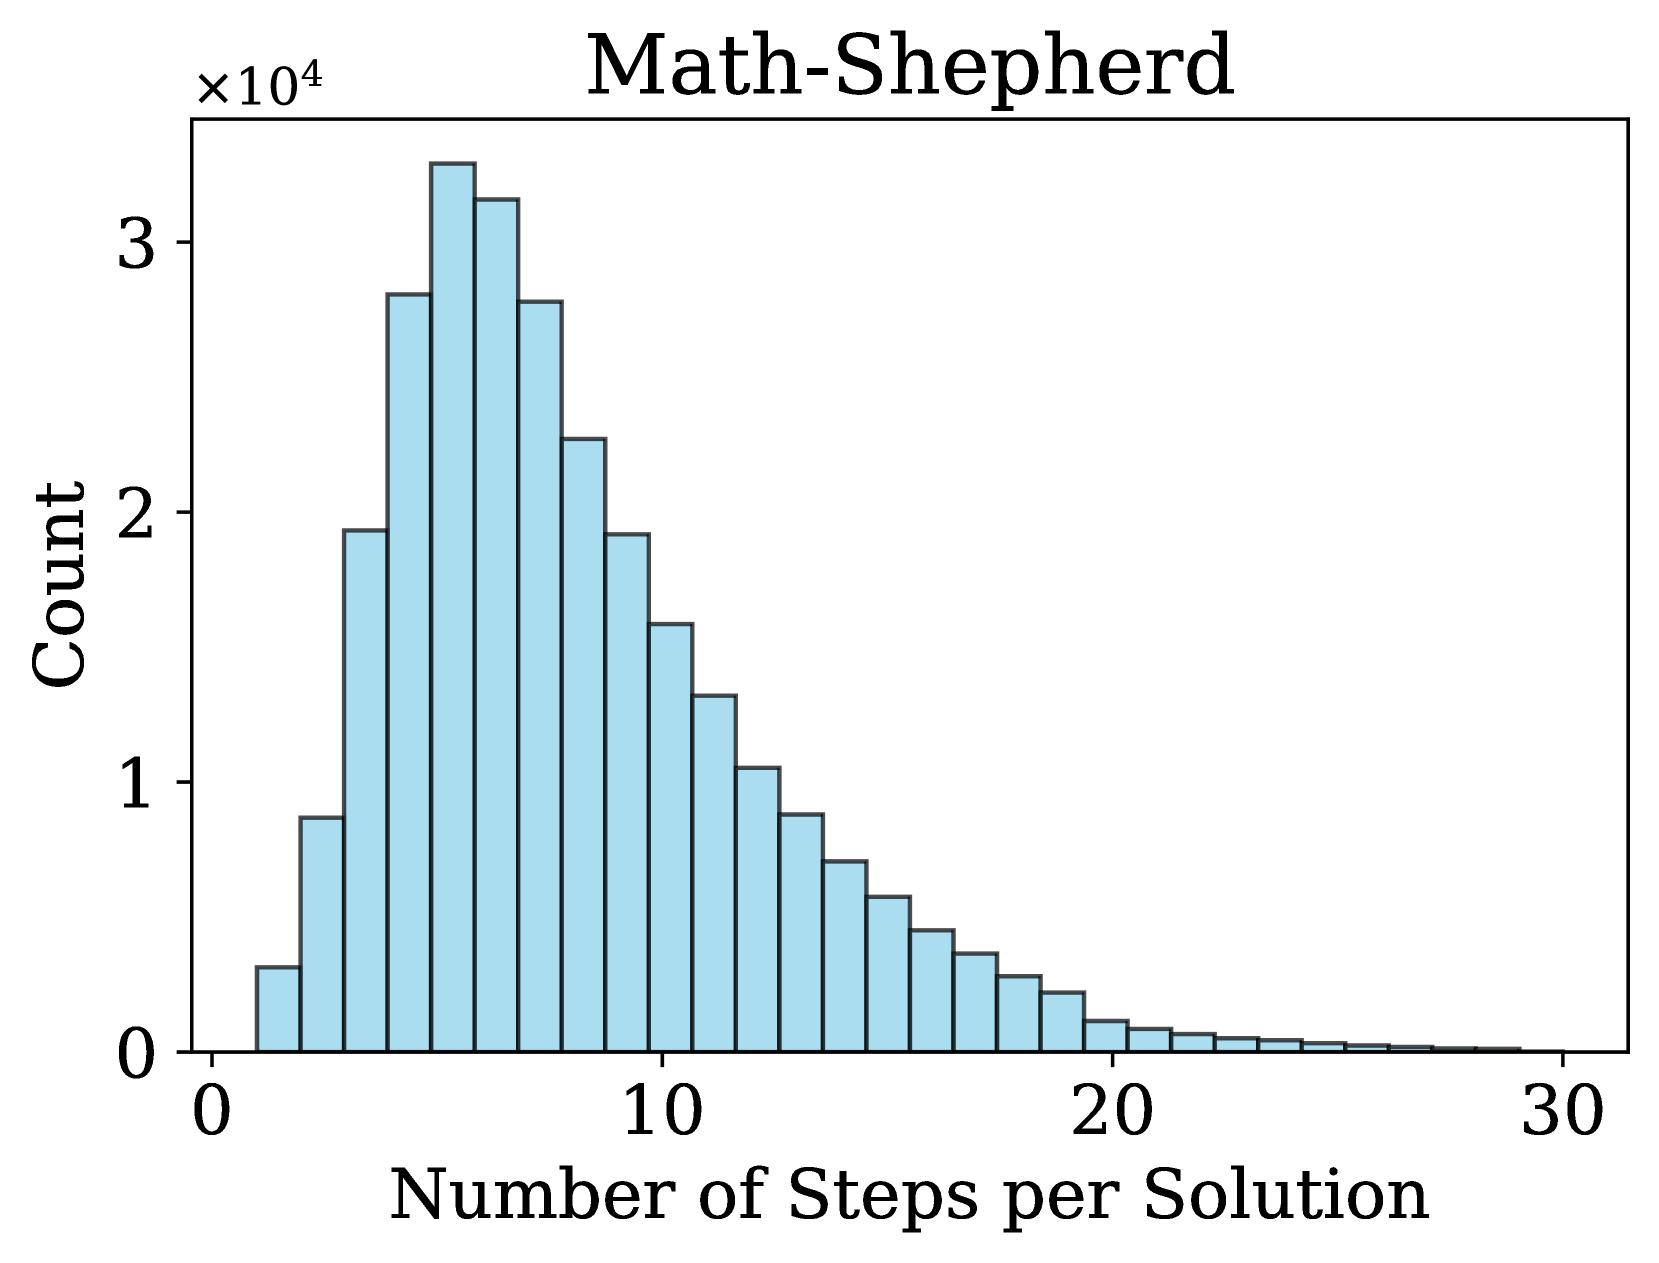
The image is a histogram titled "Math-Shepherd" that displays the frequency distribution of the number of steps required to solve problems within a dataset or system called "Math-Shepherd." The chart shows a right-skewed distribution, indicating that most solutions require a relatively small number of steps, with a long tail of solutions requiring many more steps.
### Components/Axes
* **Title:** "Math-Shepherd" (centered at the top).
* **X-Axis:**
* **Label:** "Number of Steps per Solution" (centered below the axis).
* **Scale:** Linear scale from 0 to 30, with major tick marks at 0, 10, 20, and 30.
* **Y-Axis:**
* **Label:** "Count" (rotated vertically on the left side).
* **Scale:** Linear scale from 0 to 3, with a multiplier of **×10⁴** (10,000) indicated at the top-left corner of the axis. Major tick marks are at 0, 1, 2, and 3 (representing 0, 10,000, 20,000, and 30,000 respectively).
* **Data Series:** A single series represented by light blue bars with black outlines. There is no legend, as there is only one data category.
### Detailed Analysis
The histogram consists of approximately 30 bars, each representing a bin for the number of steps (likely 1-step bins from 1 to 30). The height of each bar corresponds to the count of solutions falling within that step range.
**Trend Verification:** The visual trend shows a rapid increase in count from 1 step to a peak, followed by a steady, gradual decline as the number of steps increases. The distribution is positively skewed (right-skewed).
**Estimated Data Points (Approximate Values):**
* **Peak:** The highest bar is located at approximately **6 steps**. Its height is slightly above the 3 mark on the y-axis, indicating a count of **~32,000** (3.2 × 10⁴).
* **Adjacent Peaks:** The bars for 5 and 7 steps are also very high, at approximately **~28,000** and **~31,000** respectively.
* **Rise:** The count increases sharply from ~3,000 at 1 step to the peak at 6 steps.
* **Decline:** After the peak, the count decreases steadily. By 10 steps, the count is approximately **~19,000**. By 15 steps, it is approximately **~7,000**. By 20 steps, it is approximately **~2,000**. The tail extends to 30 steps, where the count is very low, likely in the low hundreds or less.
### Key Observations
1. **Dominant Mode:** The vast majority of solutions in the Math-Shepherd dataset are completed in **fewer than 15 steps**, with the highest concentration between 4 and 10 steps.
2. **Right Skew:** The distribution has a long right tail, indicating the presence of a smaller number of problems that are significantly more complex, requiring 20, 25, or even 30 steps to solve.
3. **Unimodal Distribution:** There is a single, clear peak, suggesting a central tendency around 5-7 steps for problem complexity.
4. **Scale:** The total number of solutions represented is large. A rough visual integration suggests the total count is likely in the range of **200,000 to 300,000** solutions.
### Interpretation
This histogram characterizes the computational or logical complexity of the Math-Shepherd dataset. The data suggests that:
* **Core Complexity:** The "typical" or most common problem in this set can be solved in a moderate number of steps (5-7). This defines the baseline complexity for the system.
* **Problem Spectrum:** The dataset contains a full spectrum of difficulty, from very simple (1-3 steps) to highly complex (25+ steps). The right skew is typical for many real-world problem sets, where most tasks are of moderate difficulty, and extreme outliers are rare.
* **System Implications:** For an AI or algorithm being tested on Math-Shepherd, performance on the 4-10 step range is critical, as this represents the bulk of the data. However, robustness would be measured by its ability to handle the long tail of complex problems. The distribution provides a benchmark for expected solution length and can be used to analyze the efficiency of different solving methods.