## Histogram: Math-Shepherd
### Overview
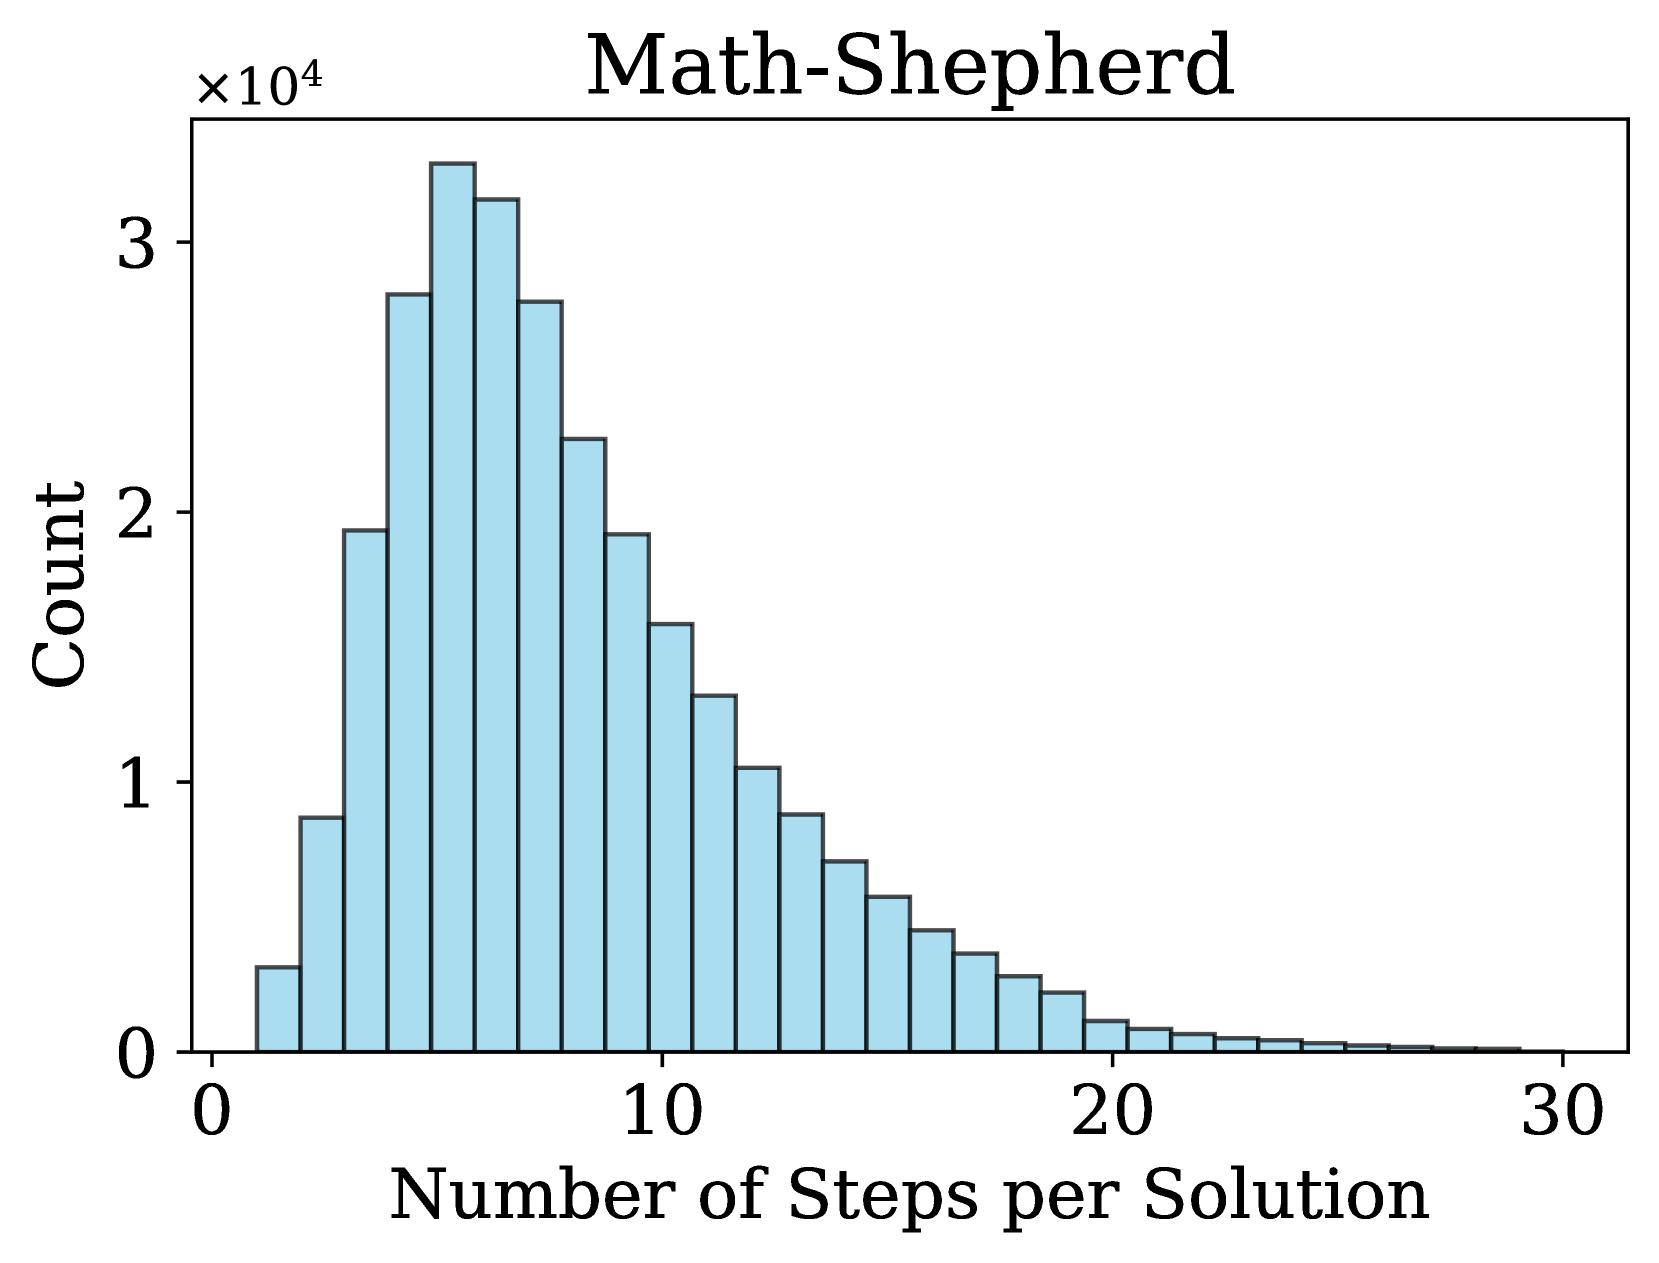
The image displays a histogram titled "Math-Shepherd" with a right-skewed distribution. The x-axis represents the "Number of Steps per Solution" (0–30), and the y-axis represents "Count" scaled by ×10⁴. The bars are uniformly blue, with no legend present. The distribution peaks sharply at lower step counts and tapers off exponentially toward higher step counts.
### Components/Axes
- **Title**: "Math-Shepherd" (top-center, bold black text).
- **Y-Axis**:
- Label: "Count" (left-aligned, black text).
- Scale: Linear increments of 1×10⁴ (0, 1×10⁴, 2×10⁴, 3×10⁴).
- **X-Axis**:
- Label: "Number of Steps per Solution" (bottom-center, black text).
- Scale: Discrete intervals of 5 steps (0, 5, 10, ..., 30).
- **Bars**:
- Color: Light blue (uniform across all bars).
- Orientation: Vertical, aligned with x-axis intervals.
### Detailed Analysis
- **Step Count Distribution**:
- **0–5 steps**:
- Counts range from ~2×10⁴ (0 steps) to ~3×10⁴ (5 steps).
- **5–10 steps**:
- Counts drop to ~2.5×10⁴ (10 steps).
- **10–15 steps**:
- Counts decrease to ~1.5×10⁴ (15 steps).
- **15–20 steps**:
- Counts further reduce to ~8×10³ (20 steps).
- **20–30 steps**:
- Counts fall below ~2×10³, with negligible values beyond 25 steps.
### Key Observations
1. **Peak Efficiency**: The highest frequency (~3×10⁴) occurs at 5 steps, indicating most solutions are resolved in this range.
2. **Rapid Decline**: Counts decrease by ~50% between 5 and 10 steps, and by ~75% between 10 and 20 steps.
3. **Long Tail**: Solutions requiring >20 steps are rare, with counts dropping to ~1×10³ or lower.
4. **Skewness**: The distribution is heavily right-skewed, with the mean likely closer to 5–10 steps.
### Interpretation
The histogram suggests that the Math-Shepherd process is highly efficient for solutions requiring ≤10 steps, with diminishing returns as complexity increases. The sharp decline in counts for >20 steps implies that solutions requiring excessive steps are either uncommon or represent edge cases. This pattern could reflect algorithmic optimization for simpler problems or a need for improved strategies for complex cases. The absence of a legend or additional annotations limits contextual understanding of the data source or methodology.