## Chart: LM Loss vs. PFLOP/s-days
### Overview
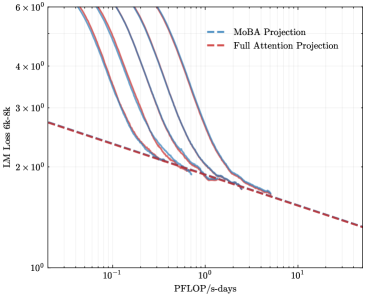
The image is a line chart comparing the Language Model (LM) Loss of "MoBA Projection" and "Full Attention Projection" models against the computational cost measured in PFLOP/s-days. The y-axis represents LM Loss (6k-8k), and the x-axis represents PFLOP/s-days. The chart shows how the loss decreases as the computational cost increases for both models.
### Components/Axes
* **X-axis:** PFLOP/s-days (Peta Floating Point Operations per second-days). The scale is logarithmic, with markers at 10<sup>-1</sup>, 10<sup>0</sup> (1), and 10<sup>1</sup> (10).
* **Y-axis:** LM Loss 6k-8k (Language Model Loss between 6000 and 8000). The scale is logarithmic, with markers at 1 x 10<sup>0</sup> (1), 2 x 10<sup>0</sup> (2), 3 x 10<sup>0</sup> (3), 4 x 10<sup>0</sup> (4), and 6 x 10<sup>0</sup> (6).
* **Legend:** Located in the top-right corner.
* "MoBA Projection" is represented by a dashed blue line.
* "Full Attention Projection" is represented by a dashed red line.
### Detailed Analysis
* **MoBA Projection:** The chart contains multiple blue lines, which appear to represent different runs or configurations of the MoBA Projection model. All blue lines show a similar trend: a steep decrease in LM Loss as PFLOP/s-days increases initially, followed by a more gradual decrease.
* At PFLOP/s-days = 0.1, the LM Loss ranges from approximately 4.5 x 10<sup>0</sup> to 6 x 10<sup>0</sup>.
* At PFLOP/s-days = 1, the LM Loss is approximately 2 x 10<sup>0</sup> for all MoBA Projection lines.
* At PFLOP/s-days = 10, the LM Loss is approximately 1.7 x 10<sup>0</sup> for all MoBA Projection lines.
* **Full Attention Projection:** The red dashed line represents the Full Attention Projection model. The LM Loss decreases as PFLOP/s-days increases.
* At PFLOP/s-days = 0.1, the LM Loss is approximately 2.7 x 10<sup>0</sup>.
* At PFLOP/s-days = 1, the LM Loss is approximately 1.9 x 10<sup>0</sup>.
* At PFLOP/s-days = 10, the LM Loss is approximately 1.3 x 10<sup>0</sup>.
### Key Observations
* The MoBA Projection model initially has a higher LM Loss than the Full Attention Projection model at lower PFLOP/s-days values.
* As PFLOP/s-days increases, the LM Loss for both models decreases.
* The MoBA Projection model seems to converge to a similar LM Loss as the Full Attention Projection model at higher PFLOP/s-days values.
* There are multiple runs or configurations for the MoBA Projection model, as indicated by the multiple blue lines.
### Interpretation
The chart compares the performance of two language models, MoBA Projection and Full Attention Projection, in terms of LM Loss versus computational cost. The data suggests that while MoBA Projection initially has a higher loss, its performance converges towards that of Full Attention Projection as the computational cost increases. The multiple lines for MoBA Projection could indicate that the model's performance is sensitive to hyperparameter tuning or initialization. The Full Attention Projection model shows a more consistent decrease in loss with increasing computational cost. The chart demonstrates the trade-off between computational cost and model performance, highlighting how increasing computational resources can lead to lower language model loss for both models.