## Chart: LMI Loss vs. PFLOP/s-days
### Overview
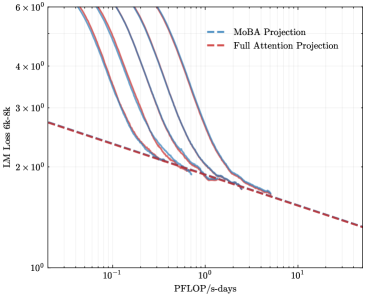
The image presents a chart illustrating the relationship between LMI Loss (6k-8k) and PFLOP/s-days for two different projection methods: MoBA Projection and Full Attention Projection. The chart uses a logarithmic scale for both axes. Multiple lines are plotted for each projection method, showing the trend of loss reduction as PFLOP/s-days increase.
### Components/Axes
* **X-axis:** PFLOP/s-days, ranging from approximately 10<sup>-1</sup> to 10<sup>1</sup> (logarithmic scale).
* **Y-axis:** LMI Loss (6k-8k), ranging from approximately 10<sup>0</sup> to 6 x 10<sup>6</sup> (logarithmic scale).
* **Legend:** Located in the top-right corner.
* MoBA Projection (Blue dashed line)
* Full Attention Projection (Red dashed line)
* **Data Series:** Multiple lines are plotted for each projection method, representing different runs or configurations.
### Detailed Analysis
**MoBA Projection (Blue dashed lines):**
There are approximately 5 blue dashed lines. The lines generally slope downwards, indicating that as PFLOP/s-days increase, the LMI Loss decreases.
* Line 1: Starts at approximately (0.1, 5.5 x 10<sup>6</sup>) and decreases to approximately (10, 1.5 x 10<sup>2</sup>).
* Line 2: Starts at approximately (0.1, 5.5 x 10<sup>6</sup>) and decreases to approximately (10, 1.5 x 10<sup>2</sup>).
* Line 3: Starts at approximately (0.1, 5.5 x 10<sup>6</sup>) and decreases to approximately (10, 1.5 x 10<sup>2</sup>).
* Line 4: Starts at approximately (0.1, 5.5 x 10<sup>6</sup>) and decreases to approximately (10, 1.5 x 10<sup>2</sup>).
* Line 5: Starts at approximately (0.1, 5.5 x 10<sup>6</sup>) and decreases to approximately (10, 1.5 x 10<sup>2</sup>).
**Full Attention Projection (Red dashed lines):**
There are approximately 5 red dashed lines. These lines also slope downwards, but generally remain above the MoBA Projection lines.
* Line 1: Starts at approximately (0.1, 5.5 x 10<sup>6</sup>) and decreases to approximately (10, 5 x 10<sup>1</sup>).
* Line 2: Starts at approximately (0.1, 5.5 x 10<sup>6</sup>) and decreases to approximately (10, 5 x 10<sup>1</sup>).
* Line 3: Starts at approximately (0.1, 5.5 x 10<sup>6</sup>) and decreases to approximately (10, 5 x 10<sup>1</sup>).
* Line 4: Starts at approximately (0.1, 5.5 x 10<sup>6</sup>) and decreases to approximately (10, 5 x 10<sup>1</sup>).
* Line 5: Starts at approximately (0.1, 5.5 x 10<sup>6</sup>) and decreases to approximately (10, 5 x 10<sup>1</sup>).
### Key Observations
* The MoBA Projection consistently achieves lower LMI Loss values compared to the Full Attention Projection across the entire range of PFLOP/s-days.
* The lines for each projection method are relatively close together, suggesting consistent performance within each method.
* The rate of loss reduction appears to decrease as PFLOP/s-days increase, indicating diminishing returns.
* The initial loss values are very high, and the logarithmic scale compresses the visual difference at higher loss values.
### Interpretation
The chart demonstrates that the MoBA Projection method is more efficient than the Full Attention Projection method in reducing LMI Loss for a given amount of computational resources (PFLOP/s-days). Both methods show a clear trade-off between computational cost and loss reduction. The diminishing returns observed at higher PFLOP/s-days suggest that there is a point beyond which increasing computational resources yields only marginal improvements in LMI Loss. The multiple lines for each method likely represent different experimental runs or variations in hyperparameters, and their proximity indicates robustness of the methods. The logarithmic scale is crucial for visualizing the large range of loss values, but it also means that small absolute differences in loss at lower values are visually amplified. This chart is likely used to evaluate the efficiency and scalability of different projection methods in a machine learning context, specifically related to language modeling (LMI).