## Line Chart: LM Loss vs. Compute (PFLOP/s-days)
### Overview
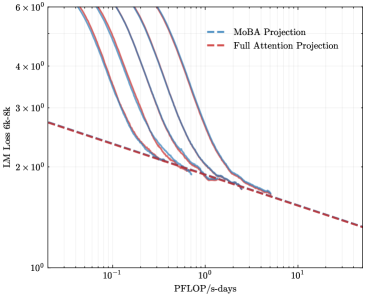
The image is a log-log line chart comparing the projected language model (LM) loss as a function of computational resources (measured in PFLOP/s-days) for two different model architectures or projection methods: "MoBA Projection" and "Full Attention Projection." The chart demonstrates how model loss decreases with increased compute, with the MoBA projection showing a steeper initial decline that converges with the Full Attention projection at higher compute levels.
### Components/Axes
* **Chart Type:** 2D line chart with logarithmic scales on both axes.
* **X-Axis:**
* **Label:** `PFLOP/s-days`
* **Scale:** Logarithmic (base 10).
* **Range & Ticks:** Spans from approximately `10^-1` (0.1) to `10^1` (10). Major tick marks are at `10^-1`, `10^0` (1), and `10^1`.
* **Y-Axis:**
* **Label:** `LM Loss (ck-3k)`
* **Scale:** Logarithmic (base 10).
* **Range & Ticks:** Spans from `10^0` (1) to `6 × 10^0` (6). Major tick marks are at `10^0`, `2 × 10^0`, `3 × 10^0`, `4 × 10^0`, and `6 × 10^0`.
* **Legend:**
* **Position:** Top-right corner of the plot area.
* **Entries:**
1. `MoBA Projection` - Represented by a blue dashed line (`--`).
2. `Full Attention Projection` - Represented by a red dashed line (`--`).
### Detailed Analysis
**1. Data Series: Full Attention Projection (Red Dashed Line)**
* **Trend:** A straight line with a constant negative slope on the log-log plot, indicating a power-law relationship (Loss ∝ Compute^(-α)).
* **Key Data Points (Approximate):**
* At `0.1 PFLOP/s-days`: Loss ≈ `2.7`
* At `1 PFLOP/s-days`: Loss ≈ `1.9`
* At `10 PFLOP/s-days`: Loss ≈ `1.3`
**2. Data Series: MoBA Projection (Blue Dashed Lines)**
* **Trend:** A family of curves (at least 5 distinct lines are visible). Each curve starts at a higher loss for low compute, decreases steeply, and then flattens out, converging towards the Full Attention line. The curves appear to represent different model sizes or configurations within the MoBA framework.
* **Key Observations & Approximate Points:**
* **Starting Points (Leftmost, ~0.1 PFLOP/s-days):** The curves are spread vertically. The highest visible curve starts near `6.0` loss, while the lowest starts near `3.0` loss.
* **Convergence Zone:** All MoBA curves converge into a tight band between `1` and `2 PFLOP/s-days`. In this region, their loss values are very close to the Full Attention line, ranging approximately from `1.8` to `2.0`.
* **Rightmost Points (~2-3 PFLOP/s-days):** The converged MoBA band continues to decrease, closely following the trajectory of the Full Attention line. The last clearly visible point for the MoBA band is at approximately `2.5 PFLOP/s-days` with a loss of about `1.7`.
### Key Observations
1. **Power-Law Scaling:** Both projections follow a power-law scaling trend (linear on a log-log plot), a common pattern in neural scaling laws.
2. **Efficiency Crossover:** At low compute budgets (< ~1 PFLOP/s-day), the Full Attention projection predicts lower loss than most MoBA configurations. However, the MoBA projections show a much steeper improvement rate.
3. **Convergence:** Around `1-2 PFLOP/s-days`, the MoBA projections catch up to and converge with the Full Attention projection. Beyond this point, their performance is nearly indistinguishable on this chart.
4. **MoBA Variability:** The spread of the blue curves at low compute suggests that the MoBA architecture's performance is highly sensitive to its specific configuration (e.g., model size, hyperparameters) when resources are limited.
### Interpretation
This chart presents a comparative scaling analysis between a "Full Attention" transformer baseline and a "MoBA" (likely an efficient attention variant) architecture.
* **The Core Message:** The data suggests that while the efficient MoBA architecture may be less sample-efficient at very small scales, it achieves comparable performance to the full attention model once a sufficient compute threshold (~1-2 PFLOP/s-days) is reached. This implies MoBA could be a more efficient choice for large-scale training, as it likely offers lower computational or memory cost per training step for equivalent loss.
* **Underlying Principle:** The steeper slope of the MoBA curves indicates a better "scaling exponent" – it extracts more performance gain per additional unit of compute in the mid-curve region. The convergence suggests a fundamental limit or a point of diminishing returns where architectural differences matter less than total compute.
* **Practical Implication:** For a project with a compute budget below the convergence point, Full Attention might be preferable. For projects scaling beyond that point, MoBA becomes an attractive alternative, promising similar final performance with potentially lower operational costs. The spread in MoBA curves also highlights the importance of proper configuration to achieve optimal scaling.