## Line Graph: Environment Steps to Success vs. Number of Actions
### Overview
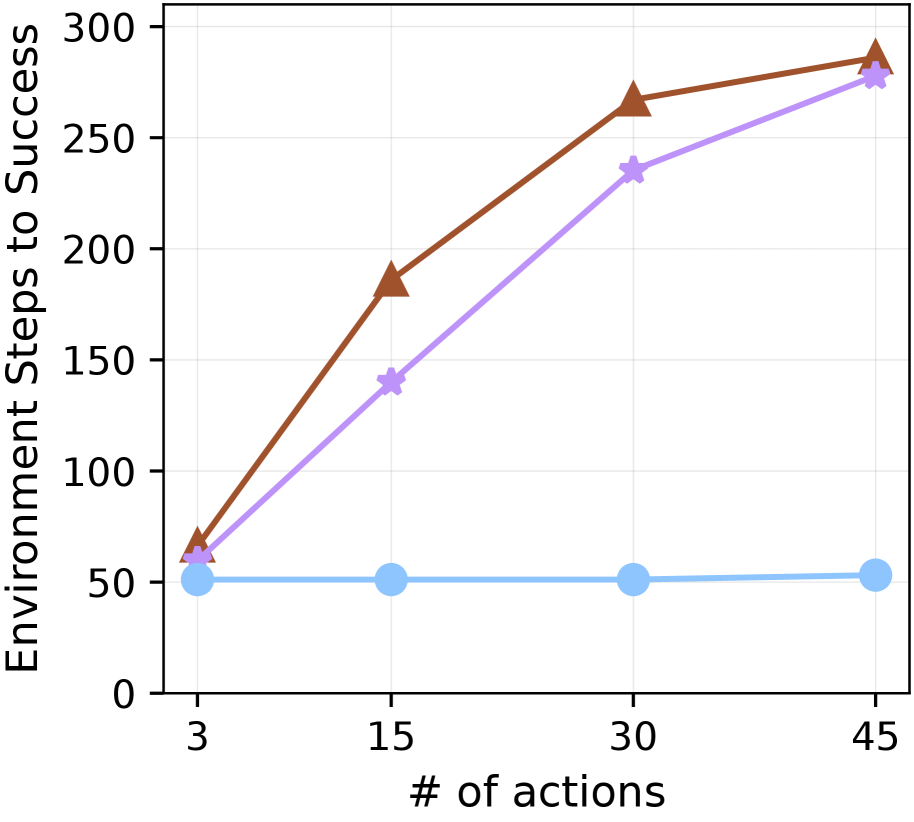
The image depicts a line graph comparing three strategies ("Strategy A," "Strategy B," and "Baseline") across four action thresholds (3, 15, 30, 45 actions). The y-axis measures "Environment Steps to Success" (0–300), while the x-axis represents the number of actions. The legend is positioned in the top-right corner, with distinct markers for each strategy: brown triangles (Strategy A), purple stars (Strategy B), and blue circles (Baseline).
### Components/Axes
- **X-axis**: Labeled "# of actions," with discrete values at 3, 15, 30, and 45.
- **Y-axis**: Labeled "Environment Steps to Success," scaled from 0 to 300 in increments of 50.
- **Legend**: Located in the top-right corner, associating:
- Brown triangles → Strategy A
- Purple stars → Strategy B
- Blue circles → Baseline
- **Data Series**:
- **Strategy A**: Brown line with triangular markers.
- **Strategy B**: Purple line with star markers.
- **Baseline**: Blue line with circular markers.
### Detailed Analysis
1. **Strategy A (Brown)**:
- At 3 actions: ~60 steps.
- At 15 actions: ~180 steps.
- At 30 actions: ~260 steps.
- At 45 actions: ~280 steps.
- **Trend**: Steady upward slope, with the sharpest increase between 3 and 15 actions.
2. **Strategy B (Purple)**:
- At 3 actions: ~60 steps.
- At 15 actions: ~140 steps.
- At 30 actions: ~230 steps.
- At 45 actions: ~275 steps.
- **Trend**: Gradual upward trajectory, with a slower rate of improvement after 30 actions compared to Strategy A.
3. **Baseline (Blue)**:
- At all action thresholds: ~50–55 steps.
- **Trend**: Flat line, indicating no improvement with increased actions.
### Key Observations
- Both Strategy A and Strategy B show significant improvement in "Environment Steps to Success" as the number of actions increases.
- Strategy A outperforms Strategy B at all action thresholds, with a more pronounced acceleration in performance.
- The Baseline remains constant, suggesting no inherent improvement without intervention.
- At 45 actions, Strategy A achieves ~280 steps, while Strategy B reaches ~275 steps, with a narrow gap between them.
### Interpretation
The data suggests that increasing the number of actions correlates with improved success metrics, but the effectiveness of the strategy matters. Strategy A demonstrates the highest efficiency, achieving near-maximum performance (280 steps) with 45 actions. Strategy B, while effective, lags slightly behind. The Baseline’s stagnation highlights the necessity of active intervention. The graph implies diminishing returns for Strategy A after 30 actions, as the growth rate slows, whereas Strategy B’s performance plateaus more gradually. This could indicate differing scalability or resource requirements between the two strategies.