## Bar Chart: Token Distribution Across Object Types and Video Frames
### Overview
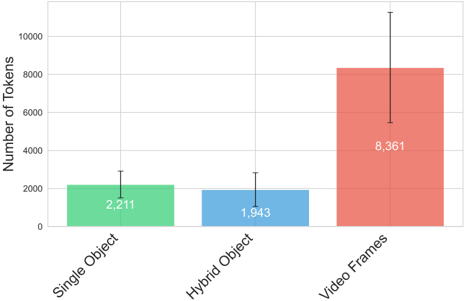
The chart compares the number of tokens required for three categories: Single Object, Hybrid Object, and Video Frames. It uses vertical bars with error bars to represent central values and uncertainty. Video Frames dominate in token count, while Single Object and Hybrid Object show smaller, comparable values.
### Components/Axes
- **X-Axis**: Categories labeled "Single Object," "Hybrid Object," and "Video Frames."
- **Y-Axis**: "Number of Tokens" with a scale from 0 to 10,000 in increments of 2,000.
- **Legend**: Implicit color coding (green = Single Object, blue = Hybrid Object, red = Video Frames).
- **Error Bars**: Vertical lines with caps above/below each bar, indicating uncertainty ranges.
### Detailed Analysis
1. **Single Object**:
- Value: 2,211 tokens (green bar).
- Error Bar: ±~200 tokens (approximate, based on bar height).
2. **Hybrid Object**:
- Value: 1,943 tokens (blue bar).
- Error Bar: ±~150 tokens.
3. **Video Frames**:
- Value: 8,361 tokens (red bar).
- Error Bar: ±~1,500 tokens (largest uncertainty).
### Key Observations
- **Dominance of Video Frames**: Video Frames require ~4x more tokens than Single Object and ~4.3x more than Hybrid Object.
- **Uncertainty Trends**: Video Frames exhibit the highest variability (error bar spans ~18% of its value), while Single Object and Hybrid Object have lower uncertainty (~9% and ~8%, respectively).
- **Hybrid Object Efficiency**: Slightly lower token count than Single Object despite combining features, suggesting optimized representation.
### Interpretation
The data highlights that video frames are significantly more token-intensive, likely due to their dynamic, multi-modal nature (e.g., spatial-temporal complexity). The large uncertainty in Video Frames may reflect variability in video content (e.g., resolution, motion, or encoding differences). Hybrid Objects, while combining elements of Single Objects, show marginal efficiency gains, possibly through shared tokenization strategies. This suggests that tokenization models prioritize granularity for video data, which could impact computational costs in applications like video analysis or generative AI.