## Chart: Confidence vs. Target Length in College Chemistry
### Overview
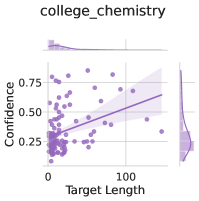
The image presents a scatter plot showing the relationship between "Confidence" and "Target Length" in the context of college chemistry. The plot includes marginal distributions (histograms/density plots) along the axes to show the distribution of each variable. A regression line with a confidence interval is overlaid on the scatter plot.
### Components/Axes
* **Title:** college\_chemistry
* **X-axis:** Target Length
* Scale: 0 to 100, with increments of 50.
* **Y-axis:** Confidence
* Scale: 0 to 0.75, with increments of 0.25.
* **Data Points:** Lilac colored dots representing individual data points.
* **Regression Line:** Lilac colored line showing the linear relationship between Target Length and Confidence.
* **Confidence Interval:** Shaded lilac area around the regression line, representing the uncertainty in the estimated relationship.
* **Marginal Distributions:**
* Top: Histogram/density plot of Target Length.
* Right: Histogram/density plot of Confidence.
### Detailed Analysis
* **Scatter Plot:**
* The scatter plot shows a positive correlation between Target Length and Confidence. As Target Length increases, Confidence tends to increase as well.
* There is a cluster of points with low Target Length (around 0-20) and Confidence values ranging from 0 to 0.5.
* The data points are somewhat scattered, indicating that the relationship is not perfectly linear.
* **Regression Line:**
* The regression line has a positive slope, confirming the positive correlation.
* The confidence interval widens as Target Length increases, suggesting that the uncertainty in the relationship is greater for longer target lengths.
* **Marginal Distributions:**
* Target Length: The distribution is skewed to the right, indicating that most target lengths are relatively short.
* Confidence: The distribution is somewhat bimodal, with peaks around 0.25 and 0.5.
### Key Observations
* Positive correlation between Target Length and Confidence.
* Higher density of data points at lower Target Length values.
* Increasing uncertainty in the relationship as Target Length increases.
### Interpretation
The data suggests that in the context of college chemistry, there is a tendency for higher confidence to be associated with longer target lengths. This could be due to various factors, such as longer targets being more complex and requiring a deeper understanding, or longer targets being more thoroughly studied and therefore leading to higher confidence. The increasing uncertainty at higher target lengths could be due to the limited number of data points in that range, or it could indicate that the relationship is more complex for longer targets. The bimodal distribution of confidence suggests that there may be two distinct groups of data points, one with lower confidence and one with higher confidence. Further investigation would be needed to determine the underlying causes of these patterns.