\n
## Scatter Plot with Marginal Distributions: College Chemistry Confidence vs. Target Length
### Overview
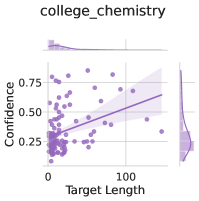
The image is a statistical visualization, specifically a scatter plot with marginal distribution plots (histograms/density plots) on the top and right sides. It displays the relationship between "Target Length" and "Confidence" for a dataset labeled "college_chemistry". The plot includes a fitted regression line with a confidence interval band.
### Components/Axes
* **Title:** "college_chemistry" (centered at the top).
* **Main Plot Axes:**
* **X-axis (Bottom):** Label is "Target Length". The scale runs from 0 to approximately 150, with major tick marks at 0 and 100.
* **Y-axis (Left):** Label is "Confidence". The scale runs from 0.25 to 0.75, with major tick marks at 0.25, 0.50, and 0.75.
* **Data Series:**
* **Scatter Points:** Numerous purple circular data points are scattered across the plot area.
* **Regression Line:** A solid purple line runs through the data, showing a positive linear trend.
* **Confidence Band:** A semi-transparent, light purple shaded area surrounds the regression line, representing the confidence interval.
* **Marginal Plots:**
* **Top Marginal Plot:** A distribution plot (likely a histogram or kernel density estimate) for the "Target Length" variable. It shows a right-skewed distribution, with the highest density near 0 and a long tail extending to the right.
* **Right Marginal Plot:** A distribution plot for the "Confidence" variable. It shows a roughly unimodal distribution centered around 0.4-0.5, with a spread from approximately 0.25 to 0.75.
* **Legend:** There is no separate legend box. The color purple is used consistently for all data elements (points, line, band, marginal plots).
### Detailed Analysis
* **Data Point Distribution:** The purple data points are most densely clustered in the lower-left quadrant of the plot, where "Target Length" is between 0 and 50 and "Confidence" is between 0.25 and 0.50. As "Target Length" increases beyond 50, the points become more sparse but generally trend upward in "Confidence".
* **Trend Line Analysis:** The solid purple regression line has a clear positive slope. It originates at a "Confidence" value of approximately 0.30 when "Target Length" is 0 and rises to a "Confidence" value of approximately 0.60 when "Target Length" is 150. This indicates a positive correlation between the two variables.
* **Confidence Interval:** The light purple shaded band around the regression line is narrower at lower "Target Length" values (where data is dense) and widens significantly as "Target Length" increases (where data is sparse), indicating greater uncertainty in the trend estimate for longer target lengths.
* **Marginal Distributions:**
* The top plot confirms the right-skew of "Target Length": most observed lengths are short (<50), with fewer instances of very long targets.
* The right plot shows "Confidence" values are most commonly found in the 0.35 to 0.55 range.
### Key Observations
1. **Positive Correlation:** There is a visible positive linear relationship between Target Length and Confidence.
2. **Heteroscedasticity:** The spread of data points around the trend line increases as Target Length increases. The relationship appears noisier for longer targets.
3. **Data Density Imbalance:** The vast majority of data points are concentrated at short Target Lengths (<50). The trend for longer lengths is inferred from relatively few data points.
4. **Outliers:** A few data points exist with high Confidence (>0.65) at moderate Target Lengths (50-100), and some points with low Confidence (<0.30) at longer Target Lengths (>100).
### Interpretation
The data suggests that in the context of "college_chemistry," tasks or items with longer target lengths (which could represent longer answers, more complex problems, or extended text passages) are associated with higher measured confidence. This could imply several underlying phenomena:
* **Model Behavior:** If this plots a model's performance, it may be more confident in its predictions or generations when dealing with longer, potentially more detailed or context-rich inputs/outputs.
* **Task Nature:** Longer chemistry problems might contain more clues or structured information, leading to higher confidence in solving them, albeit with greater variability (as shown by the wider scatter).
* **Data Skew:** The strong right-skew in target length is critical. The positive trend is robustly supported by a large amount of data at short lengths but becomes more speculative for longer lengths due to sparse data. The widening confidence band visually communicates this increasing uncertainty.
* **Practical Implication:** One should be cautious when extrapolating this trend to very long target lengths (>150), as the model's confidence behavior in that region is less certain. The core reliable insight is the positive relationship within the densely populated region of the data (Target Length 0-80).
**Language:** All text in the image is in English.