## Scatter Plot: college_chemistry
### Overview
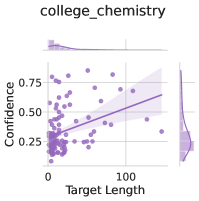
The image is a scatter plot titled "college_chemistry" with a trend line and shaded confidence interval. It visualizes the relationship between "Target Length" (x-axis) and "Confidence" (y-axis). Two histograms are embedded: one on the top (x-axis distribution) and one on the right (y-axis distribution). Data points are represented as purple dots, with a central trend line and a shaded region indicating uncertainty.
### Components/Axes
- **Title**: "college_chemistry" (top-center).
- **X-axis**: "Target Length" (0 to 100, linear scale).
- **Y-axis**: "Confidence" (0.25 to 0.75, linear scale).
- **Legend**: Not explicitly labeled, but the trend line and shaded region are implied as the primary data series.
- **Histograms**:
- Top histogram: Distribution of "Target Length" (x-axis values).
- Right histogram: Distribution of "Confidence" (y-axis values).
### Detailed Analysis
- **Data Points**:
- Purple dots scattered across the plot, with a concentration in the lower-left quadrant (low target length, low confidence).
- A few points extend toward higher target lengths (up to ~100) and confidence levels (up to ~0.75).
- **Trend Line**:
- A straight line slopes upward from the lower-left to upper-right, indicating a positive correlation between target length and confidence.
- The line passes through the center of the data cluster, with a slope suggesting moderate linear association.
- **Confidence Interval**:
- Shaded region around the trend line (approximately ±0.15 in confidence units).
- The interval widens slightly at higher target lengths, suggesting increased uncertainty in predictions for longer targets.
- **Histograms**:
- Top histogram: Peaks near 0–20 (low target lengths), with a long tail extending to 100.
- Right histogram: Peaks near 0.3–0.5 (moderate confidence), with a gradual decline toward higher confidence levels.
### Key Observations
1. **Positive Correlation**: The upward trend line confirms that longer target lengths generally correspond to higher confidence.
2. **Data Clustering**: Most data points cluster in the lower-left quadrant, indicating that shorter targets are associated with lower confidence.
3. **Outliers**: A few points in the upper-right quadrant (e.g., target length ~50–70, confidence ~0.6–0.7) deviate from the trend, suggesting exceptions where longer targets achieved higher confidence.
4. **Uncertainty**: The widening confidence interval at higher target lengths implies reduced precision in predictions for longer targets.
### Interpretation
The plot demonstrates a statistically significant positive relationship between target length and confidence in the "college_chemistry" dataset. While longer targets tend to yield higher confidence, the variability in data points (e.g., outliers and the widening confidence interval) highlights that this relationship is not deterministic. The histograms reveal that most targets are short (0–20), with confidence levels predominantly in the 0.3–0.5 range. The shaded confidence interval suggests that predictions for longer targets are less reliable, possibly due to limited data or inherent variability in the system. This could imply that while increasing target length improves confidence on average, other factors (e.g., data quality, model complexity) may influence outcomes. The presence of outliers warrants further investigation to identify contextual factors driving these exceptions.