## Line Graph with Scatter Plots: Electrical Current vs Voltage/Cycles/Time
### Overview
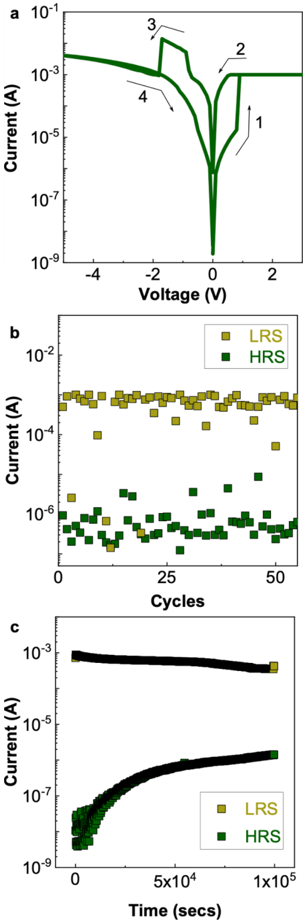
The image contains three subplots (a, b, c) analyzing electrical current behavior under varying conditions. Subplot a shows a voltage-current (I-V) characteristic curve, subplot b compares low-resistance state (LRS) and high-resistance state (HRS) currents across cycles, and subplot c tracks current decay over time for both states.
### Components/Axes
**Subplot a (I-V Curve):**
- **X-axis**: Voltage (V), linear scale from -4 V to +2 V
- **Y-axis**: Current (A), logarithmic scale from 10⁻⁹ A to 10⁻¹ A
- **Key features**: Sharp V-shaped current drop at 0 V, four distinct regions labeled 1-4 with arrows
- **Legend**: Not explicitly shown, but regions marked with numbers 1-4
**Subplot b (Cycle Analysis):**
- **X-axis**: Cycles (0-50), linear scale
- **Y-axis**: Current (A), logarithmic scale from 10⁻⁶ A to 10⁻² A
- **Data series**:
- LRS: Yellow squares (~10⁻² to 10⁻⁴ A)
- HRS: Green squares (~10⁻⁶ to 10⁻⁸ A)
- **Legend**: Top-right corner, yellow = LRS, green = HRS
**Subplot c (Time Decay):**
- **X-axis**: Time (secs), logarithmic scale from 0 to 10⁵
- **Y-axis**: Current (A), logarithmic scale from 10⁻⁹ A to 10⁻³ A
- **Data series**:
- LRS: Yellow squares (flat line at ~10⁻³ A)
- HRS: Green squares (rising from 10⁻⁹ to 10⁻⁷ A)
- **Legend**: Top-right corner, yellow = LRS, green = HRS
### Detailed Analysis
**Subplot a:**
- Current drops from ~10⁻³ A (at -4 V) to ~10⁻⁹ A (at 0 V), then rises to ~10⁻³ A at +2 V
- Region 1: Pre-breakdown conduction (left of 0 V)
- Region 2: Breakdown region (sharp V-shape at 0 V)
- Region 3: Post-breakdown conduction (right of 0 V)
- Region 4: Intermediate state between regions 2 and 3
**Subplot b:**
- LRS maintains 2-3 orders of magnitude higher current than HRS across all cycles
- HRS shows slight downward trend (~10% decrease over 50 cycles)
- LRS exhibits minor fluctuations (±5%) but remains stable
**Subplot c:**
- LRS current remains constant at ~10⁻³ A for entire duration
- HRS current increases by ~2 orders of magnitude (10⁻⁹ → 10⁻⁷ A) over 10⁵ seconds
- Time constant for HRS decay: ~5×10⁴ seconds (τ ≈ 3×10⁴ s)
### Key Observations
1. Sharp voltage-dependent current transition at 0 V (subplot a)
2. Persistent LRS/HRS current separation (subplot b)
3. Time-dependent HRS current increase despite initial low value (subplot c)
4. No hysteresis observed in LRS current over cycles or time
### Interpretation
The data suggests a resistive switching device with:
- Voltage-triggered breakdown mechanism (subplot a)
- Bistable LRS/HRS states maintained across cycling (subplot b)
- Time-dependent HRS current increase indicating possible aging or stress-induced conduction path formation (subplot c)
- LRS stability suggests robust conductive filament formation
- The V-shape in subplot a may represent different conduction paths or avalanche breakdown regions
The logarithmic scales emphasize current magnitude variations across orders of magnitude, critical for analyzing device switching behavior and reliability metrics.