## Chart: Training Accuracy
### Overview
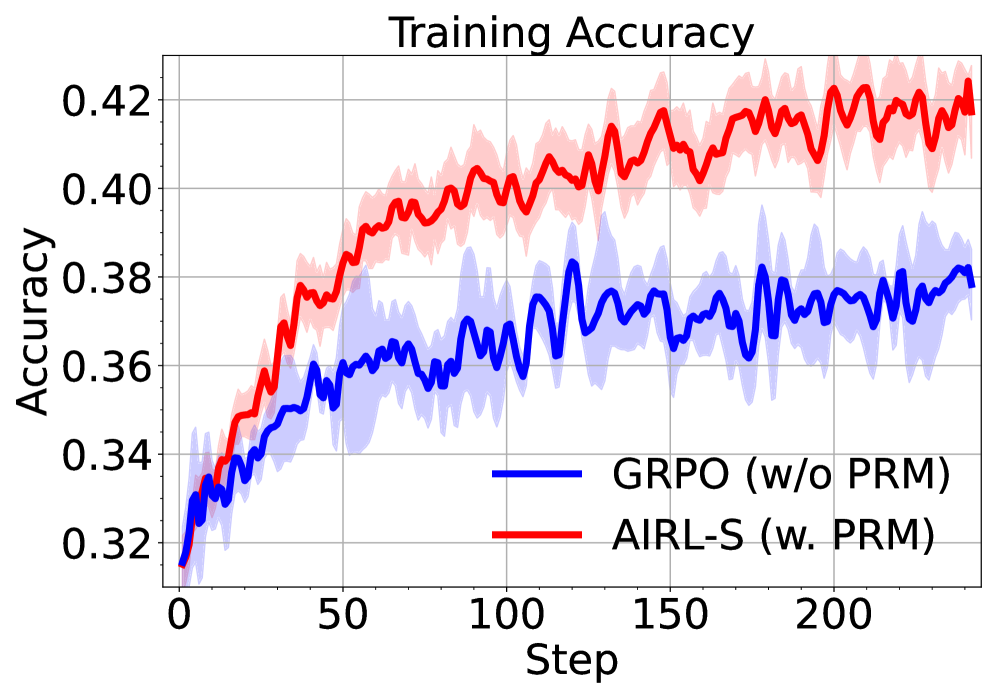
The image is a line graph comparing the training accuracy of two algorithms, GRPO (w/o PRM) and AIRL-S (w. PRM), over a number of steps. The graph shows the accuracy of each algorithm as a function of the training step, with shaded regions indicating the variance or standard deviation around the mean accuracy.
### Components/Axes
* **Title:** Training Accuracy
* **X-axis:** Step, with markers at 0, 50, 100, 150, and 200.
* **Y-axis:** Accuracy, with markers at 0.32, 0.34, 0.36, 0.38, 0.40, and 0.42.
* **Legend:** Located at the bottom of the chart.
* Blue line: GRPO (w/o PRM)
* Red line: AIRL-S (w. PRM)
### Detailed Analysis
* **GRPO (w/o PRM) - Blue Line:**
* Trend: The blue line generally slopes upward, indicating an increase in accuracy as the number of steps increases. The line exhibits fluctuations.
* Data Points:
* At step 0, accuracy is approximately 0.32.
* At step 50, accuracy is approximately 0.36.
* At step 100, accuracy is approximately 0.37.
* At step 150, accuracy is approximately 0.37.
* At step 200, accuracy is approximately 0.38.
* **AIRL-S (w. PRM) - Red Line:**
* Trend: The red line generally slopes upward, indicating an increase in accuracy as the number of steps increases. The line exhibits fluctuations.
* Data Points:
* At step 0, accuracy is approximately 0.32.
* At step 50, accuracy is approximately 0.38.
* At step 100, accuracy is approximately 0.40.
* At step 150, accuracy is approximately 0.41.
* At step 200, accuracy is approximately 0.42.
### Key Observations
* Both algorithms show an increase in accuracy as the number of training steps increases.
* AIRL-S (w. PRM) consistently outperforms GRPO (w/o PRM) in terms of training accuracy.
* The shaded regions around each line indicate the variance in the accuracy, with AIRL-S (w. PRM) showing less variance than GRPO (w/o PRM).
### Interpretation
The data suggests that AIRL-S (w. PRM) is a more effective algorithm for this particular training task, as it achieves higher accuracy and exhibits less variance compared to GRPO (w/o PRM). The inclusion of PRM (presumably a specific technique or module) in AIRL-S appears to contribute to its superior performance. The increasing accuracy of both algorithms over time indicates that they are learning and improving their performance as they are exposed to more training data. The fluctuations in the lines suggest that the learning process is not perfectly smooth and may be affected by noise or other factors.