## Line Chart:Time Decay (sorted along channel axis)
### Overview
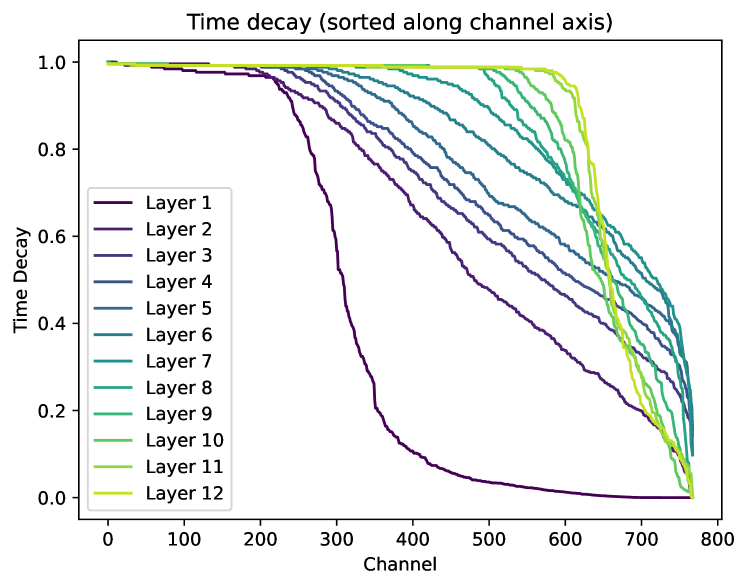
The chart displays time decay trends across 12 layers (Layer 1 to Layer 12) as a function of channel index (0–800). Each layer is represented by a distinct colored line, with decay values normalized between 0.0 and 1.0. Lines are sorted along the channel axis, with Layer 1 (dark purple) at the top and Layer 12 (yellow) at the bottom.
### Components/Axes
- **X-axis (Channel)**: Linear scale from 0 to 800, labeled "Channel."
- **Y-axis (Time Decay)**: Linear scale from 0.0 to 1.0, labeled "Time Decay."
- **Legend**: Positioned in the bottom-left corner, listing layers 1–12 with corresponding colors (dark purple to yellow).
- **Lines**: 12 distinct lines, each representing a layer. Colors transition from dark purple (Layer 1) to yellow (Layer 12).
### Detailed Analysis
- **Layer 1 (dark purple)**: Starts at 1.0, decays gradually to ~0.2 by channel 800. Minimal decay in channels 0–200, sharp drop between 200–400, and gradual decline thereafter.
- **Layer 2 (medium purple)**: Similar to Layer 1 but steeper decay. Reaches ~0.4 by channel 800.
- **Layers 3–9 (blue to teal)**: Intermediate decay rates. Layers 3–5 decay to ~0.6–0.8 by channel 800; Layers 6–9 decay to ~0.4–0.6.
- **Layer 10 (light green)**: Steeper decay than Layers 3–9. Drops to ~0.3 by channel 800.
- **Layer 11 (lime green)**: Rapid decay; reaches ~0.2 by channel 800.
- **Layer 12 (yellow)**: Sharpest decay. Drops to ~0.1 by channel 800.
### Key Observations
1. **Decay Rate Correlation**: Higher-numbered layers (10–12) exhibit significantly faster decay than lower-numbered layers (1–9).
2. **Channel Threshold**: All layers show minimal decay (<0.2) in channels 0–100. A critical threshold occurs between channels 300–500, where decay accelerates sharply.
3. **Layer Ordering**: Lines are sorted by decay rate, with Layer 12 (yellow) having the steepest slope and Layer 1 (dark purple) the gentlest.
4. **Normalization**: All lines start at 1.0, indicating 100% time decay at channel 0.
### Interpretation
The data suggests that time decay is inversely proportional to layer number, with higher layers (10–12) experiencing rapid degradation in channel performance. The sharp decay threshold between channels 300–500 implies a structural or operational limit in the system, beyond which additional channels contribute minimally to time decay. Layer 12’s extreme sensitivity (yellow line) may indicate a critical failure mode or resource exhaustion point. The sorting of layers along the channel axis could reflect prioritization of channels by decay resilience, with Layer 1 (dark purple) representing the most stable configuration.