## Line Chart: Test Result on OlympiadBench
### Overview
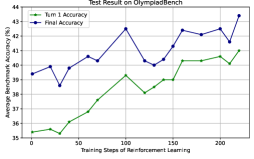
The image is a line chart titled "Test Result on OlympiadBench," comparing two metrics: **Turn 1 Accuracy** (green line) and **Final Accuracy** (blue line) across **Training Steps of Reinforcement Learning** (x-axis). The y-axis represents **Average Benchmark Accuracy (%)**, ranging from 35% to 44%. The chart shows performance trends over 200 training steps, with both metrics generally increasing but exhibiting fluctuations.
---
### Components/Axes
- **X-axis**: "Training Steps of Reinforcement Learning" (0 to 200, in increments of 50).
- **Y-axis**: "Average Benchmark Accuracy (%)" (35% to 44%, in 1% increments).
- **Legend**:
- **Turn 1 Accuracy**: Green line (bottom-left placement).
- **Final Accuracy**: Blue line (top-left placement).
---
### Detailed Analysis
#### Turn 1 Accuracy (Green Line)
- **Initial Value**: ~35.5% at 0 steps.
- **Trend**: Gradual increase with minor fluctuations.
- Peaks at ~39% around 100 steps.
- Stabilizes between ~38% and ~40% after 150 steps.
- **Final Value**: ~40.5% at 200 steps.
#### Final Accuracy (Blue Line)
- **Initial Value**: ~38.5% at 0 steps.
- **Trend**: Steeper growth with volatility.
- Sharp peak at ~42.5% around 100 steps.
- Dips to ~40% at 125 steps, then rises to ~43% by 200 steps.
- **Final Value**: ~43.5% at 200 steps.
---
### Key Observations
1. **Final Accuracy consistently exceeds Turn 1 Accuracy** across all steps.
2. **Both metrics show improvement** with more training steps, but **Final Accuracy has greater variability** (e.g., sharp peaks and troughs).
3. **Highest performance** for both metrics occurs around **100 steps**, followed by stabilization.
4. **Turn 1 Accuracy** plateaus earlier (~150 steps) compared to **Final Accuracy**, which continues improving until 200 steps.
---
### Interpretation
The data suggests that **reinforcement learning improves performance over time**, with **Final Accuracy** reflecting a more robust or optimized model state. The **Turn 1 Accuracy** likely represents initial, less refined results, while **Final Accuracy** captures the model's stabilized performance after iterative training. The **volatility in Final Accuracy** (e.g., the dip at 125 steps) may indicate challenges in convergence or sensitivity to hyperparameters. The **higher final value** (~43.5% vs. ~40.5%) underscores the value of extended training, though diminishing returns are evident after 150 steps.
This chart highlights the trade-off between **early-stage performance** (Turn 1) and **long-term optimization** (Final Accuracy), critical for evaluating reinforcement learning strategies in benchmark tasks.