## Chart: Test Result on OlympiadBench
### Overview
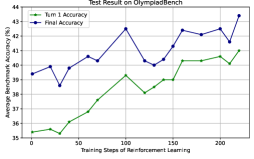
The image is a line graph titled "Test Result on OlympiadBench". It shows the average benchmark accuracy (%) on the y-axis versus the training steps of reinforcement learning on the x-axis. There are two data series plotted: "Turn 1 Accuracy" and "Final Accuracy".
### Components/Axes
* **Title:** Test Result on OlympiadBench
* **X-axis:** Training Steps of Reinforcement Learning
* Scale: 0 to 200, with tick marks at 0, 50, 100, 150, and 200.
* **Y-axis:** Average Benchmark Accuracy (%)
* Scale: 35 to 44, with tick marks at each integer value.
* **Legend:** Located in the top-left corner.
* "Turn 1 Accuracy" is represented by a green line.
* "Final Accuracy" is represented by a dark blue line.
### Detailed Analysis
* **Turn 1 Accuracy (Green Line):**
* Trend: Generally increasing with some fluctuations.
* Data Points:
* At 0 steps: ~35.4%
* At 25 steps: ~35.3%
* At 50 steps: ~36.8%
* At 75 steps: ~38.2%
* At 100 steps: ~39.2%
* At 125 steps: ~38.1%
* At 150 steps: ~39.0%
* At 175 steps: ~40.3%
* At 200 steps: ~40.1%
* At 225 steps: ~41.0%
* **Final Accuracy (Dark Blue Line):**
* Trend: Fluctuating, but generally increasing.
* Data Points:
* At 0 steps: ~39.4%
* At 25 steps: ~38.6%
* At 50 steps: ~39.8%
* At 75 steps: ~40.6%
* At 100 steps: ~42.5%
* At 125 steps: ~40.1%
* At 150 steps: ~40.4%
* At 175 steps: ~42.4%
* At 200 steps: ~42.1%
* At 225 steps: ~43.3%
### Key Observations
* The "Final Accuracy" starts higher than the "Turn 1 Accuracy".
* Both accuracies generally increase with training steps.
* The "Final Accuracy" fluctuates more than the "Turn 1 Accuracy".
* The "Final Accuracy" appears to plateau or slightly decrease towards the end of the training steps.
### Interpretation
The graph illustrates the performance of a reinforcement learning model on the OlympiadBench dataset. The "Turn 1 Accuracy" represents the accuracy of the model after the first turn, while the "Final Accuracy" represents the accuracy after all turns. The increasing trend in both accuracies suggests that the model is learning and improving its performance as it is trained. The fluctuations in the "Final Accuracy" could be due to the stochastic nature of reinforcement learning or the complexity of the task. The fact that the "Final Accuracy" starts higher than the "Turn 1 Accuracy" indicates that the model is already performing reasonably well at the beginning of training. The plateauing of the "Final Accuracy" towards the end of training suggests that the model may be approaching its maximum performance on this dataset.