\n
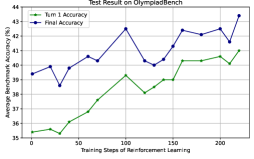
## Line Chart: Test Result on OlympiadBench
### Overview
This image presents a line chart illustrating the performance of a model on the OlympiadBench benchmark, measured by "Turn 1 Accuracy" and "Final Accuracy" as a function of "Training Steps of Reinforcement Learning". The chart displays the evolution of these accuracy metrics over approximately 200 training steps.
### Components/Axes
* **Title:** "Test Result on OlympiadBench" (Top-center)
* **X-axis:** "Training Steps of Reinforcement Learning" (Bottom-center), ranging from 0 to 200, with markers at increments of 50.
* **Y-axis:** "Average Benchmark Accuracy (%)" (Left-center), ranging from 35% to 44%, with markers at increments of 1.
* **Legend:** Located at the top-left corner.
* "Turn 1 Accuracy" - Green line with triangle markers.
* "Final Accuracy" - Blue line with circle markers.
### Detailed Analysis
**Turn 1 Accuracy (Green Line):**
The green line representing "Turn 1 Accuracy" exhibits an overall upward trend, but with significant fluctuations.
* At 0 training steps, the accuracy is approximately 35.2%.
* It increases to around 36.5% at 50 training steps.
* It reaches a local maximum of approximately 39.5% at 125 training steps.
* It dips to around 38.5% at 150 training steps.
* Finally, it rises to approximately 40.5% at 200 training steps.
**Final Accuracy (Blue Line):**
The blue line representing "Final Accuracy" also shows an upward trend, but with more pronounced peaks and valleys.
* At 0 training steps, the accuracy is approximately 40.2%.
* It decreases to around 38.8% at 50 training steps.
* It peaks at approximately 42.5% at 100 training steps.
* It drops to around 40.2% at 150 training steps.
* It rises to approximately 42.4% at 175 training steps.
* It reaches a maximum of approximately 43.5% at 200 training steps.
### Key Observations
* "Final Accuracy" consistently outperforms "Turn 1 Accuracy" throughout the training process.
* Both accuracy metrics demonstrate a non-linear improvement, with periods of rapid growth followed by plateaus or declines.
* The "Final Accuracy" line shows a more volatile pattern than the "Turn 1 Accuracy" line, suggesting that the final result is more sensitive to the training process.
* The largest increase in "Final Accuracy" occurs between 50 and 100 training steps.
* The final accuracy at 200 steps is approximately 3.3% higher than the initial accuracy at 0 steps.
### Interpretation
The chart suggests that the reinforcement learning model improves its performance on the OlympiadBench benchmark as training progresses. The difference between "Turn 1 Accuracy" and "Final Accuracy" indicates that the model refines its solutions over multiple turns. The fluctuations in accuracy suggest that the training process is not always smooth and may be affected by factors such as the exploration-exploitation trade-off or the stochasticity of the environment. The overall upward trend demonstrates that the model is learning and adapting to the task. The fact that "Final Accuracy" is consistently higher than "Turn 1 Accuracy" suggests that the model benefits from iterative refinement of its initial solutions. The data suggests that continued training beyond 200 steps might yield further improvements, but the rate of improvement may diminish.