## Scatter Plot: Accuracy vs. Deep-Thinking Ratio
### Overview
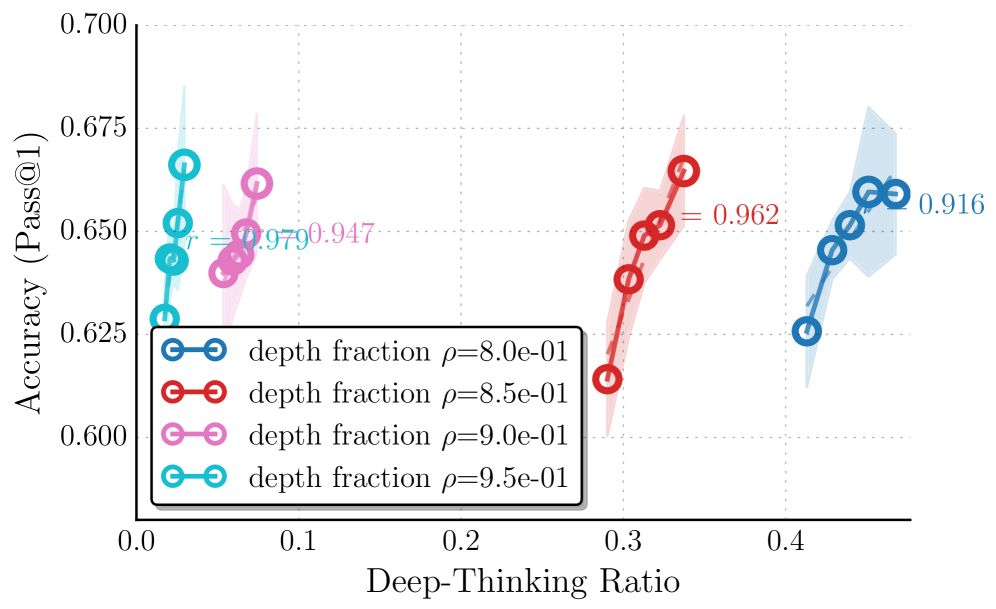
The image is a scatter plot showing the relationship between "Accuracy (Pass@1)" and "Deep-Thinking Ratio" for different "depth fraction" values. There are four data series, each representing a different depth fraction (ρ): 8.0e-01, 8.5e-01, 9.0e-01, and 9.5e-01. Each series shows an upward trend, indicating that as the Deep-Thinking Ratio increases, the Accuracy also tends to increase. Shaded regions around each line indicate uncertainty.
### Components/Axes
* **X-axis:** Deep-Thinking Ratio, ranging from 0.0 to 0.4.
* **Y-axis:** Accuracy (Pass@1), ranging from 0.600 to 0.700.
* **Legend (bottom-left):**
* Blue: depth fraction ρ=8.0e-01
* Red: depth fraction ρ=8.5e-01
* Pink: depth fraction ρ=9.0e-01
* Teal: depth fraction ρ=9.5e-01
* **Gridlines:** Horizontal and vertical dotted gridlines are present.
### Detailed Analysis
* **Depth fraction ρ=8.0e-01 (Blue):**
* Trend: Upward slope.
* Data points: Approximately (0.41, 0.625), (0.42, 0.645), (0.43, 0.655), (0.44, 0.660)
* Correlation Coefficient: r = 0.916 (located near the data series)
* **Depth fraction ρ=8.5e-01 (Red):**
* Trend: Upward slope.
* Data points: Approximately (0.27, 0.605), (0.28, 0.635), (0.29, 0.645), (0.30, 0.655)
* Correlation Coefficient: r = 0.962 (located near the data series)
* **Depth fraction ρ=9.0e-01 (Pink):**
* Trend: Upward slope.
* Data points: Approximately (0.07, 0.635), (0.08, 0.650), (0.09, 0.660)
* Correlation Coefficient: r = 0.947 (located near the data series)
* **Depth fraction ρ=9.5e-01 (Teal):**
* Trend: Upward slope.
* Data points: Approximately (0.01, 0.625), (0.02, 0.640), (0.03, 0.650), (0.04, 0.660)
* Correlation Coefficient: r = 0.979 (located near the data series)
### Key Observations
* All four depth fraction series show a positive correlation between Deep-Thinking Ratio and Accuracy.
* The teal series (ρ=9.5e-01) and pink series (ρ=9.0e-01) are clustered at lower Deep-Thinking Ratio values compared to the blue (ρ=8.0e-01) and red (ρ=8.5e-01) series.
* The red series (ρ=8.5e-01) and blue series (ρ=8.0e-01) reach higher Deep-Thinking Ratio values.
* The correlation coefficients (r values) are high for all series, indicating a strong positive linear relationship.
### Interpretation
The data suggests that increasing the Deep-Thinking Ratio generally leads to higher accuracy, regardless of the depth fraction. However, the optimal Deep-Thinking Ratio and the extent of accuracy improvement may depend on the specific depth fraction used. The high correlation coefficients indicate a strong linear relationship between the two variables within the observed ranges. The clustering of the teal and pink series at lower Deep-Thinking Ratios might indicate a limitation or constraint in achieving higher ratios with those specific depth fractions. The shaded regions around each line indicate the uncertainty in the accuracy values for each depth fraction at different Deep-Thinking Ratios.