\n
## Line Chart: Accuracy vs. Deep-Thinking Ratio
### Overview
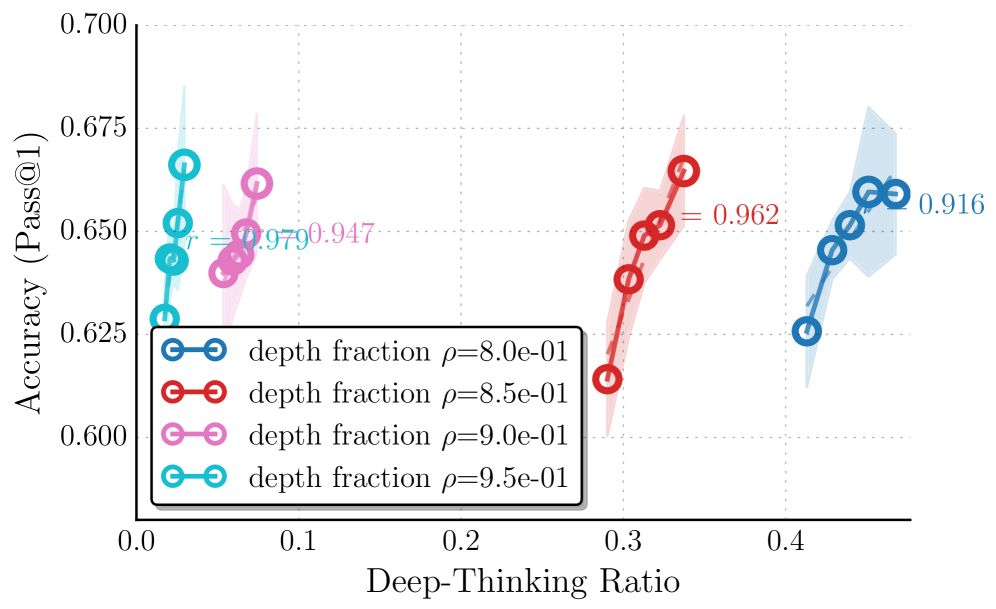
This image presents a line chart illustrating the relationship between "Deep-Thinking Ratio" and "Accuracy (Pass@1)". Four different data series are plotted, each representing a different "depth fraction" value (ρ). The chart shows how accuracy changes as the deep-thinking ratio increases.
### Components/Axes
* **X-axis:** "Deep-Thinking Ratio" ranging from 0.0 to 0.4, with markers at 0.0, 0.1, 0.2, 0.3, and 0.4.
* **Y-axis:** "Accuracy (Pass@1)" ranging from 0.600 to 0.700, with markers at 0.600, 0.625, 0.650, 0.675, and 0.700.
* **Legend:** Located in the bottom-left corner, it identifies four data series:
* depth fraction ρ=8.0e-01 (Blue line with circle markers)
* depth fraction ρ=8.5e-01 (Red line with circle markers)
* depth fraction ρ=9.0e-01 (Purple line with circle markers)
* depth fraction ρ=9.5e-01 (Teal line with circle markers)
* **Data Markers:** Each data point is marked with a circle, and error bars are present for each point.
* **Annotations:** Two data points are annotated with numerical values: (0.1, 0.979) and (0.1, 0.947), and (0.3, 0.962) and (0.4, 0.916).
### Detailed Analysis
Let's analyze each data series individually, noting trends and approximate values.
* **depth fraction ρ=8.0e-01 (Blue):** This line starts at approximately (0.0, 0.622), increases slightly to around (0.1, 0.652), plateaus around (0.2, 0.655), then increases more significantly to approximately (0.3, 0.675) and finally reaches (0.4, 0.685).
* **depth fraction ρ=8.5e-01 (Red):** This line begins at approximately (0.0, 0.618), rises to around (0.1, 0.648), continues to increase to approximately (0.2, 0.655), then increases more steeply to around (0.3, 0.670) and reaches (0.4, 0.680).
* **depth fraction ρ=9.0e-01 (Purple):** This line starts at approximately (0.0, 0.615), increases to around (0.1, 0.645), continues to increase to approximately (0.2, 0.650), then increases more steeply to around (0.3, 0.665) and reaches (0.4, 0.675).
* **depth fraction ρ=9.5e-01 (Teal):** This line begins at approximately (0.0, 0.620), rises to around (0.1, 0.650), continues to increase to approximately (0.2, 0.655), then increases more steeply to around (0.3, 0.672) and reaches (0.4, 0.682).
The annotated values at x=0.1 are (0.979, 0.947) and at x=0.4 are (0.962, 0.916). These values do not correspond to the y-axis scale.
### Key Observations
* All four lines exhibit a generally upward trend, indicating that increasing the "Deep-Thinking Ratio" tends to improve "Accuracy (Pass@1)".
* The lines are relatively close together, suggesting that the "depth fraction" parameter has a moderate effect on accuracy.
* The rate of increase in accuracy appears to be higher for larger "Deep-Thinking Ratio" values (between 0.2 and 0.4).
* The annotated values are likely errors or represent a different metric not displayed on the chart.
### Interpretation
The chart demonstrates a positive correlation between the "Deep-Thinking Ratio" and "Accuracy (Pass@1)". This suggests that incorporating more "deep thinking" into the process (whatever that entails in this context) leads to improved performance. The different "depth fraction" values represent variations in the amount of "deep thinking" applied. The relatively small differences between the lines indicate that the specific value of the "depth fraction" is less critical than simply increasing the "Deep-Thinking Ratio" overall. The increasing slope of the lines at higher "Deep-Thinking Ratio" values suggests diminishing returns – the benefit of additional "deep thinking" may decrease as the ratio increases. The annotated values are anomalous and require further investigation to understand their meaning and source. The chart is likely presenting results from an experiment or simulation evaluating the impact of a particular technique (deep thinking) on a task's accuracy.