## Scatter Plot with Error Bands: Accuracy vs. Deep-Thinking Ratio by Depth Fraction
### Overview
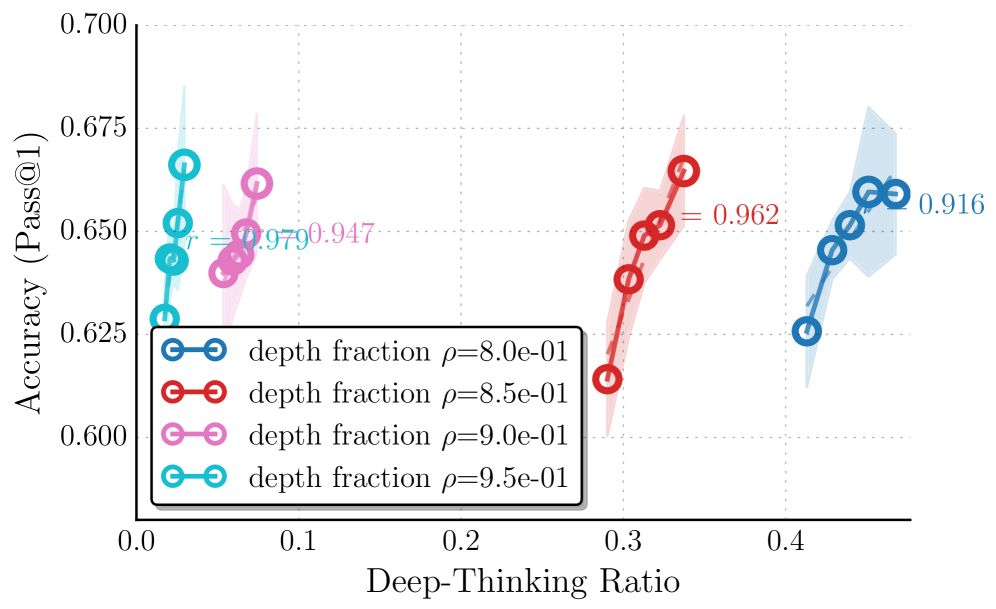
The image is a scatter plot chart displaying the relationship between "Deep-Thinking Ratio" (x-axis) and "Accuracy (Pass@1)" (y-axis) for four different model configurations, defined by their "depth fraction ρ". Each configuration is represented by a distinct color and marker style, with data points connected by lines and surrounded by shaded error bands. The chart includes a legend and specific numerical annotations near some data points.
### Components/Axes
* **X-Axis:** Labeled "Deep-Thinking Ratio". The scale runs from 0.0 to approximately 0.45, with major tick marks at 0.0, 0.1, 0.2, 0.3, and 0.4.
* **Y-Axis:** Labeled "Accuracy (Pass@1)". The scale runs from 0.600 to 0.700, with major tick marks at 0.600, 0.625, 0.650, 0.675, and 0.700.
* **Legend:** Positioned in the bottom-left quadrant of the plot area. It defines four series:
* Blue line with circle markers: `depth fraction ρ=8.0e-01`
* Red line with circle markers: `depth fraction ρ=8.5e-01`
* Pink/Magenta line with circle markers: `depth fraction ρ=9.0e-01`
* Cyan/Teal line with circle markers: `depth fraction ρ=9.5e-01`
* **Annotations:**
* Near the cyan/teal series (ρ=9.5e-01): Text `γ = 0.979` and `0.947` (the latter appears slightly faded or overlapping).
* Near the red series (ρ=8.5e-01): Text `= 0.962`.
* Near the blue series (ρ=8.0e-01): Text `0.916`.
### Detailed Analysis
**Data Series Trends and Approximate Points:**
1. **Blue Series (ρ=8.0e-01):**
* **Trend:** Positive slope. Accuracy increases as the Deep-Thinking Ratio increases.
* **Spatial Grounding & Points:** Located in the rightmost region of the chart (x ≈ 0.35 to 0.45).
* Point 1: x ≈ 0.35, y ≈ 0.625
* Point 2: x ≈ 0.38, y ≈ 0.645
* Point 3: x ≈ 0.41, y ≈ 0.655
* Point 4: x ≈ 0.44, y ≈ 0.660 (annotated with `0.916`)
2. **Red Series (ρ=8.5e-01):**
* **Trend:** Steep positive slope. Shows the most dramatic increase in accuracy with deep-thinking ratio among the series.
* **Spatial Grounding & Points:** Located in the center-right region (x ≈ 0.28 to 0.33).
* Point 1: x ≈ 0.28, y ≈ 0.615
* Point 2: x ≈ 0.30, y ≈ 0.640
* Point 3: x ≈ 0.31, y ≈ 0.650
* Point 4: x ≈ 0.33, y ≈ 0.665 (annotated with `= 0.962`)
3. **Pink/Magenta Series (ρ=9.0e-01):**
* **Trend:** Positive slope, less steep than the red series.
* **Spatial Grounding & Points:** Located in the left-center region (x ≈ 0.05 to 0.10).
* Point 1: x ≈ 0.05, y ≈ 0.640
* Point 2: x ≈ 0.06, y ≈ 0.650
* Point 3: x ≈ 0.08, y ≈ 0.660 (near the annotation `0.947`)
4. **Cyan/Teal Series (ρ=9.5e-01):**
* **Trend:** Positive slope, similar steepness to the pink series.
* **Spatial Grounding & Points:** Located in the leftmost region (x ≈ 0.02 to 0.05).
* Point 1: x ≈ 0.02, y ≈ 0.625
* Point 2: x ≈ 0.03, y ≈ 0.645
* Point 3: x ≈ 0.04, y ≈ 0.650
* Point 4: x ≈ 0.05, y ≈ 0.665 (annotated with `γ = 0.979`)
**Error Bands:** Each series has a semi-transparent shaded region of the same color surrounding its line, indicating variance or confidence intervals around the measured accuracy. The bands appear wider for the blue series at higher x-values.
### Key Observations
1. **Positive Correlation:** All four depth fraction configurations show a clear positive correlation between Deep-Thinking Ratio and Accuracy (Pass@1).
2. **Stratification by Depth Fraction:** The series are horizontally stratified. Lower depth fractions (ρ=8.0e-01, 0.85) operate at higher Deep-Thinking Ratios (0.28-0.45), while higher depth fractions (ρ=0.90, 0.95) operate at lower ratios (0.02-0.10).
3. **Performance Ceiling:** The highest achieved accuracy across all series is approximately 0.665-0.670, reached by the red (ρ=0.85) and cyan (ρ=0.95) series at their respective highest deep-thinking ratios.
4. **Annotation Values:** The numerical annotations (0.916, 0.962, 0.947, 0.979) are placed near the highest data point of each series. Given the context of "γ" (gamma) next to one, these likely represent a secondary metric or parameter value (e.g., a gamma parameter, efficiency score, or confidence value) associated with that specific operating point.
### Interpretation
The chart demonstrates a trade-off and optimization landscape for a model's reasoning process. "Deep-Thinking Ratio" likely represents the proportion of computational resources or steps dedicated to deliberate reasoning versus fast processing. "Accuracy (Pass@1)" is the primary performance metric.
The data suggests that **allocating more resources to deep thinking improves accuracy**, but the optimal operating point depends heavily on the model's "depth fraction" (ρ), which may control the model's architectural depth or capacity for parallel processing.
* **Lower depth fractions (ρ=0.80, 0.85)** require a significantly higher deep-thinking ratio (0.28+) to achieve peak performance. The red series (ρ=0.85) shows the most efficient gain, achieving near-peak accuracy with a relatively smaller increase in deep-thinking ratio.
* **Higher depth fractions (ρ=0.90, 0.95)** achieve comparable peak accuracy but at a much lower deep-thinking ratio (<0.10). This implies these configurations are more efficient at converting deep-thinking resources into accuracy gains, possibly because their greater inherent depth reduces the need for extensive sequential reasoning steps.
The annotations (γ values) might indicate a measure of efficiency or confidence at the optimal point for each configuration. The highest γ (0.979) corresponds to the most efficient configuration (ρ=0.95), which achieves high accuracy with minimal deep-thinking ratio. The lowest γ (0.916) corresponds to the least efficient configuration (ρ=0.80), which requires the highest deep-thinking ratio.
**In summary, the chart reveals that model accuracy can be improved by increasing deep-thinking allocation, but the efficiency of this improvement is governed by the model's depth fraction. Higher depth fractions enable high accuracy with less deep-thinking overhead, suggesting a more effective internal reasoning architecture.**